

At much later times as shown in Fig. 6.11 the duration of the negative phase is
shown. This so-called suction-phase is a characteristic feature occurring in explosions. This phenomenon is further shown in Fig. 6.12 where, in this instance, the
pressure-time history at a fixed Lagrangian position is plotted. This figure shows the
arrival of the shock wave at λ 0 ¼ 1 with the resulting compression of the air and its
subsequent rapid expansion to a pressure even lower than the pre-shock ambient air
pressure. One can also observe that the duration of this suction-phase is longer than
the duration of the compressive phase, with the air pressure eventually returning to
its pre-shock ambient value.
6.10.2 Density
The density profile at the very early stages shows the generation of a compression
spike at the shock front and the subsequent production of a very low pressure within
the sphere (Fig. 6.13). The generation of multiple internal shocks as in the case of the
pressure profile is evident as shown in Fig. 6.14 and these eventually die away as in
the case of the pressure profile. Figure 6.15 should be compared with figure 6 in the
article by Brode [3] for the point-source explosion at the very late stages of the
spherical expansion.
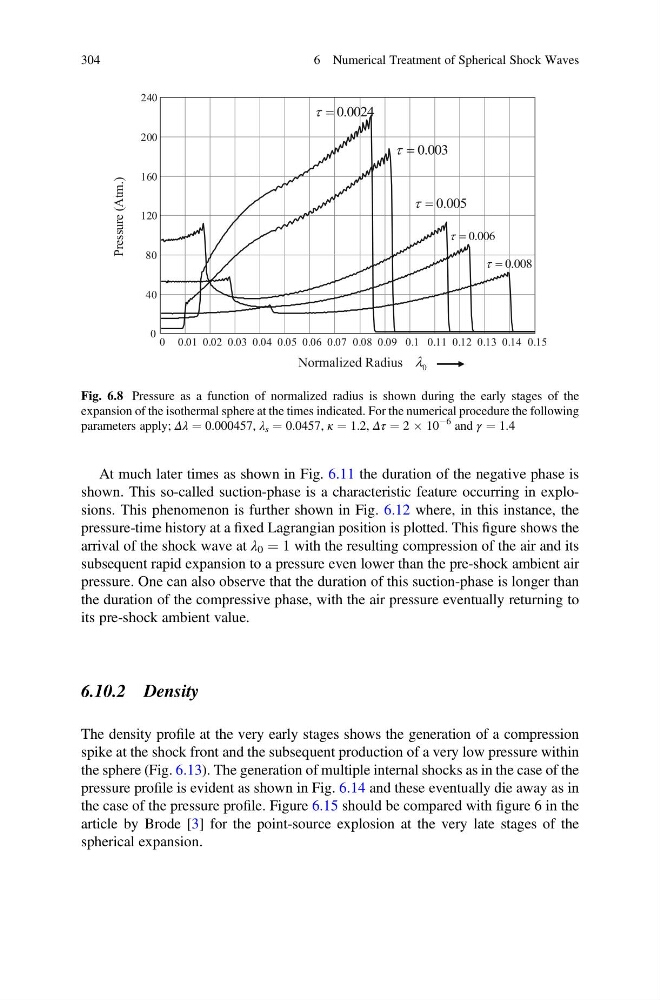
Normalized Radius
Fig. 6.8 Pressure as a function of normalized radius is shown during the early stages of the
expansion of the isothermal sphere at the times indicated. For the numerical procedure the following
parameters apply; Δλ ¼ 0.000457, λ s ¼ 0.0457, κ ¼ 1.2, Δτ ¼ 2 Â 10
À6 and γ ¼ 1.4
304
6 Numerical Treatment of Spherical Shock Waves
shown. This so-called suction-phase is a characteristic feature occurring in explosions. This phenomenon is further shown in Fig. 6.12 where, in this instance, the
pressure-time history at a fixed Lagrangian position is plotted. This figure shows the
arrival of the shock wave at λ 0 ¼ 1 with the resulting compression of the air and its
subsequent rapid expansion to a pressure even lower than the pre-shock ambient air
pressure. One can also observe that the duration of this suction-phase is longer than
the duration of the compressive phase, with the air pressure eventually returning to
its pre-shock ambient value.
6.10.2 Density
The density profile at the very early stages shows the generation of a compression
spike at the shock front and the subsequent production of a very low pressure within
the sphere (Fig. 6.13). The generation of multiple internal shocks as in the case of the
pressure profile is evident as shown in Fig. 6.14 and these eventually die away as in
the case of the pressure profile. Figure 6.15 should be compared with figure 6 in the
article by Brode [3] for the point-source explosion at the very late stages of the
spherical expansion.
Normalized Radius
Fig. 6.8 Pressure as a function of normalized radius is shown during the early stages of the
expansion of the isothermal sphere at the times indicated. For the numerical procedure the following
parameters apply; Δλ ¼ 0.000457, λ s ¼ 0.0457, κ ¼ 1.2, Δτ ¼ 2 Â 10
À6 and γ ¼ 1.4
304
6 Numerical Treatment of Spherical Shock Waves