

Within the approximations considered, Eq. (5.113) shows that the particle or
material velocity is approximately linear with Eulerian position r(r 0 , t) as already
observed in Fig. 5.1. In fact, when Eq. (5.113) is compared with Eqs. (5.2), (5.7b)
and (5.32) they are identical.
Let us now substitute Eq. (5.110) in Eqs. (5.101) and (5.104), thereby obtaining,
p r 0 , t
ð
Þ ¼ p s R
ð Þ À
1
2
p s R
ð Þ 1 À
r r 0 , t
ð
Þ
R
3γ
γÀ1
"
#
ð5:114Þ
and
ρ r 0 , t
ð
Þ
ρ 0
¼
γ þ 1
γ À 1
r r 0 , t
ð
Þ=R
ð
Þ
3γ
γÀ1 1 þ r r 0 , t
ð
Þ=R
ð
Þ
3γ
γÀ1
h
i
2
2
4
3
5
1=γ
ð5:115Þ
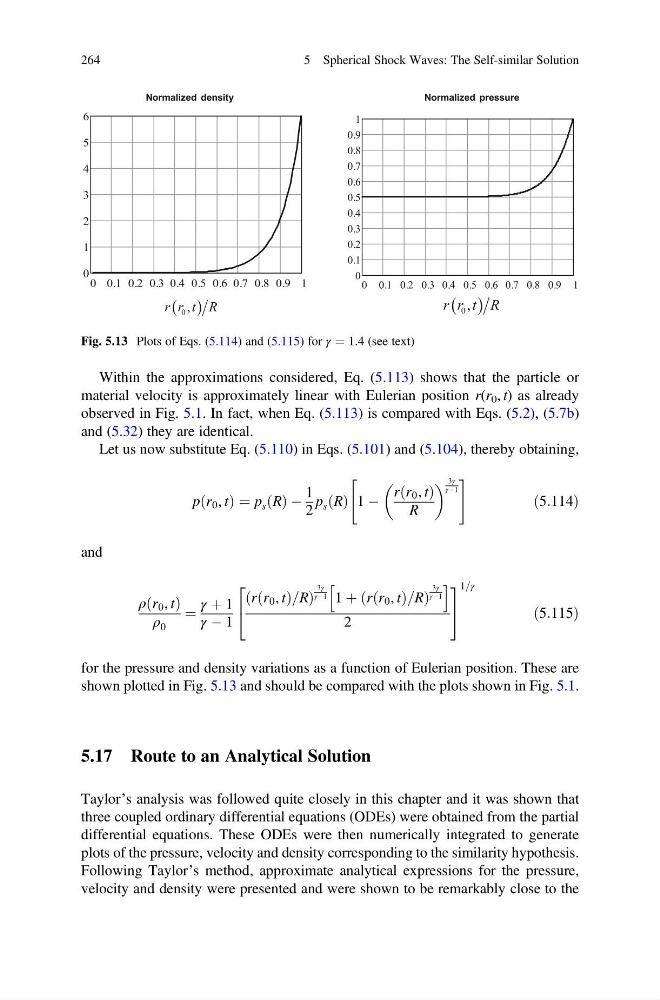
for the pressure and density variations as a function of Eulerian position. These are
shown plotted in Fig. 5.13 and should be compared with the plots shown in Fig. 5.1.
5.17 Route to an Analytical Solution
Taylor’s analysis was followed quite closely in this chapter and it was shown that
three coupled ordinary differential equations (ODEs) were obtained from the partial
differential equations. These ODEs were then numerically integrated to generate
plots of the pressure, velocity and density corresponding to the similarity hypothesis.
Following Taylor’s method, approximate analytical expressions for the pressure,
velocity and density were presented and were shown to be remarkably close to the
Fig. 5.13 Plots of Eqs. (5.114) and (5.115) for γ ¼ 1.4 (see text)
264
5 Spherical Shock Waves: The Self-similar Solution
material velocity is approximately linear with Eulerian position r(r 0 , t) as already
observed in Fig. 5.1. In fact, when Eq. (5.113) is compared with Eqs. (5.2), (5.7b)
and (5.32) they are identical.
Let us now substitute Eq. (5.110) in Eqs. (5.101) and (5.104), thereby obtaining,
p r 0 , t
ð
Þ ¼ p s R
ð Þ À
1
2
p s R
ð Þ 1 À
r r 0 , t
ð
Þ
R
3γ
γÀ1
"
#
ð5:114Þ
and
ρ r 0 , t
ð
Þ
ρ 0
¼
γ þ 1
γ À 1
r r 0 , t
ð
Þ=R
ð
Þ
3γ
γÀ1 1 þ r r 0 , t
ð
Þ=R
ð
Þ
3γ
γÀ1
h
i
2
2
4
3
5
1=γ
ð5:115Þ
for the pressure and density variations as a function of Eulerian position. These are
shown plotted in Fig. 5.13 and should be compared with the plots shown in Fig. 5.1.
5.17 Route to an Analytical Solution
Taylor’s analysis was followed quite closely in this chapter and it was shown that
three coupled ordinary differential equations (ODEs) were obtained from the partial
differential equations. These ODEs were then numerically integrated to generate
plots of the pressure, velocity and density corresponding to the similarity hypothesis.
Following Taylor’s method, approximate analytical expressions for the pressure,
velocity and density were presented and were shown to be remarkably close to the
Fig. 5.13 Plots of Eqs. (5.114) and (5.115) for γ ¼ 1.4 (see text)
264
5 Spherical Shock Waves: The Self-similar Solution