

Taylor indicates that the density according to Eq. (5.50) decreases rapidly as the
centre is approached while noting that the pressure is relatively constant in this
region. This would imply that the temperature (based on the equation, p ¼ ρRT)
increases proportionally to η
À7.5 and at first sight this might imply a very high
concentration of energy near the centre. He goes on to dismiss this assumption by
pointing out that the energy per unit volume of a gas is simply p/(γ À 1) so that the
distribution of energy is uniform in the central region since the pressure is esentially
constant (see Fig. 5.1).
5.13 The Temperature in the Central Region
Let us now investigate the temperature left behind by the blast wave in the central
region. Using the equation; p ¼ ρRT, the temperature T at any point is related to the
pressure p and density ρ by the equation,
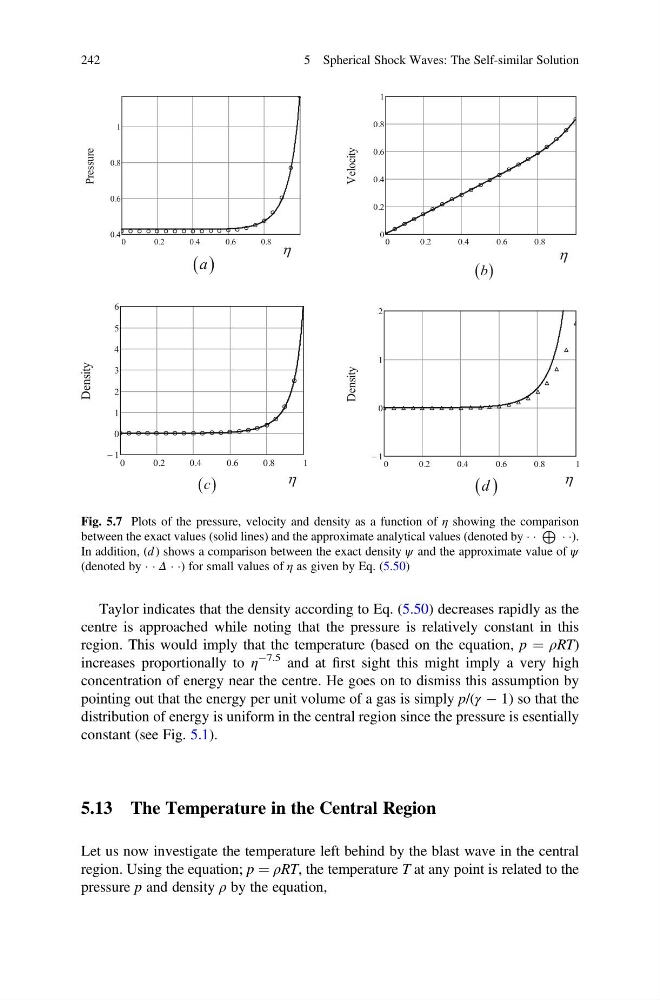
Fig. 5.7 Plots of the pressure, velocity and density as a function of η showing the comparison
between the exact values (solid lines) and the approximate analytical values (denoted by Á Á
L Á Á).
In addition, (d ) shows a comparison between the exact density ψ and the approximate value of ψ
(denoted by Á Á Δ Á Á) for small values of η as given by Eq. (5.50)
242
5 Spherical Shock Waves: The Self-similar Solution
centre is approached while noting that the pressure is relatively constant in this
region. This would imply that the temperature (based on the equation, p ¼ ρRT)
increases proportionally to η
À7.5 and at first sight this might imply a very high
concentration of energy near the centre. He goes on to dismiss this assumption by
pointing out that the energy per unit volume of a gas is simply p/(γ À 1) so that the
distribution of energy is uniform in the central region since the pressure is esentially
constant (see Fig. 5.1).
5.13 The Temperature in the Central Region
Let us now investigate the temperature left behind by the blast wave in the central
region. Using the equation; p ¼ ρRT, the temperature T at any point is related to the
pressure p and density ρ by the equation,
Fig. 5.7 Plots of the pressure, velocity and density as a function of η showing the comparison
between the exact values (solid lines) and the approximate analytical values (denoted by Á Á
L Á Á).
In addition, (d ) shows a comparison between the exact density ψ and the approximate value of ψ
(denoted by Á Á Δ Á Á) for small values of η as given by Eq. (5.50)
242
5 Spherical Shock Waves: The Self-similar Solution