

18 Bridging the Information Gap: Mapping Data Sets on Information …
217
72h
1-2 weeks
2 months
Before
Baseline Context
Flood Situation; Coordination
Service Locations
Capacity;
Security and Access;
Damage and Needs
Information needs
Joint Needs Assessment
SOS-Form
Union Fact Sheets
Flood forecasts and info
Disaster Management Plan
D-Form
Data sets and
Information
products
Timeline
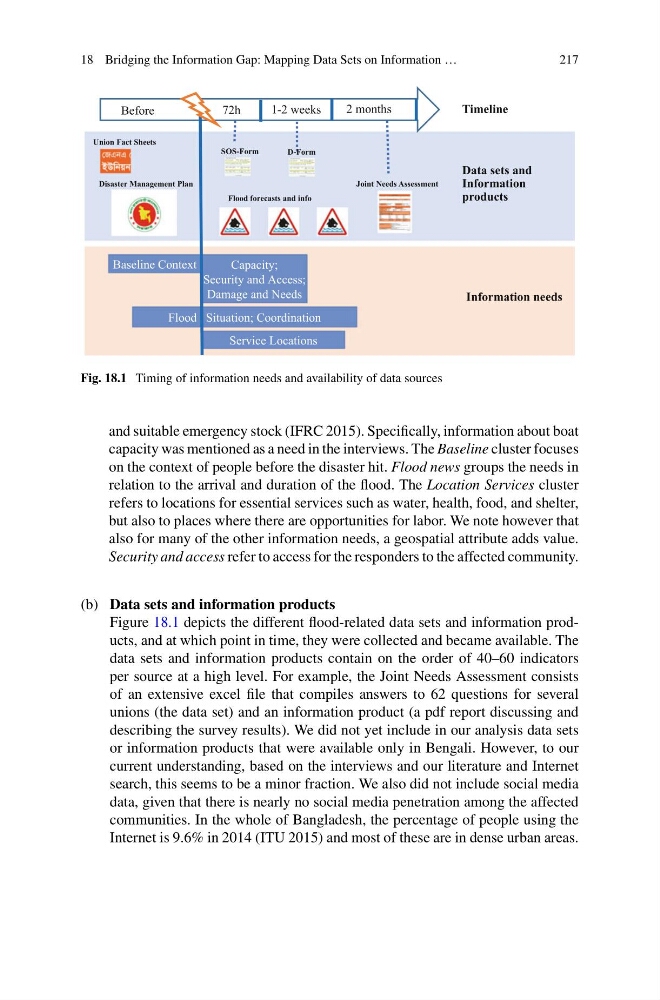
Fig. 18.1 Timing of information needs and availability of data sources
and suitable emergency stock (IFRC 2015). Specifically, information about boat
capacity was mentioned as a need in the interviews. The Baseline cluster focuses
on the context of people before the disaster hit. Flood news groups the needs in
relation to the arrival and duration of the flood. The Location Services cluster
refers to locations for essential services such as water, health, food, and shelter,
but also to places where there are opportunities for labor. We note however that
also for many of the other information needs, a geospatial attribute adds value.
Security and access refer to access for the responders to the affected community.
(b) Data sets and information products
Figure 18.1 depicts the different flood-related data sets and information products, and at which point in time, they were collected and became available. The
data sets and information products contain on the order of 40–60 indicators
per source at a high level. For example, the Joint Needs Assessment consists
of an extensive excel file that compiles answers to 62 questions for several
unions (the data set) and an information product (a pdf report discussing and
describing the survey results). We did not yet include in our analysis data sets
or information products that were available only in Bengali. However, to our
current understanding, based on the interviews and our literature and Internet
search, this seems to be a minor fraction. We also did not include social media
data, given that there is nearly no social media penetration among the affected
communities. In the whole of Bangladesh, the percentage of people using the
Internet is 9.6% in 2014 (ITU 2015) and most of these are in dense urban areas.
217
72h
1-2 weeks
2 months
Before
Baseline Context
Flood Situation; Coordination
Service Locations
Capacity;
Security and Access;
Damage and Needs
Information needs
Joint Needs Assessment
SOS-Form
Union Fact Sheets
Flood forecasts and info
Disaster Management Plan
D-Form
Data sets and
Information
products
Timeline
Fig. 18.1 Timing of information needs and availability of data sources
and suitable emergency stock (IFRC 2015). Specifically, information about boat
capacity was mentioned as a need in the interviews. The Baseline cluster focuses
on the context of people before the disaster hit. Flood news groups the needs in
relation to the arrival and duration of the flood. The Location Services cluster
refers to locations for essential services such as water, health, food, and shelter,
but also to places where there are opportunities for labor. We note however that
also for many of the other information needs, a geospatial attribute adds value.
Security and access refer to access for the responders to the affected community.
(b) Data sets and information products
Figure 18.1 depicts the different flood-related data sets and information products, and at which point in time, they were collected and became available. The
data sets and information products contain on the order of 40–60 indicators
per source at a high level. For example, the Joint Needs Assessment consists
of an extensive excel file that compiles answers to 62 questions for several
unions (the data set) and an information product (a pdf report discussing and
describing the survey results). We did not yet include in our analysis data sets
or information products that were available only in Bengali. However, to our
current understanding, based on the interviews and our literature and Internet
search, this seems to be a minor fraction. We also did not include social media
data, given that there is nearly no social media penetration among the affected
communities. In the whole of Bangladesh, the percentage of people using the
Internet is 9.6% in 2014 (ITU 2015) and most of these are in dense urban areas.