

RRAM Device Characterizations and Modelling
353
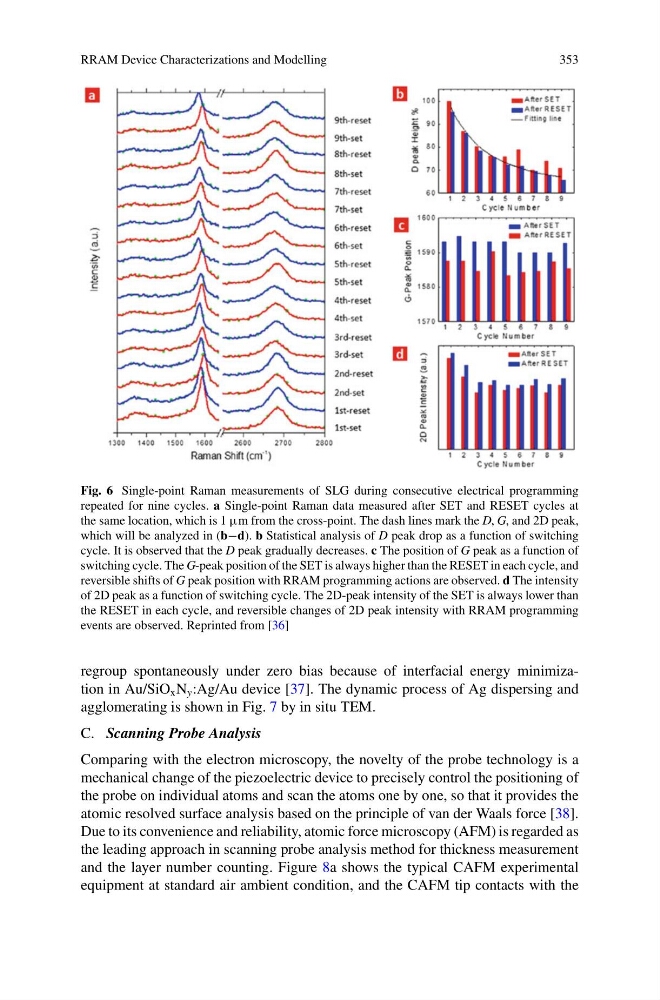
Fig. 6 Single-point Raman measurements of SLG during consecutive electrical programming
repeated for nine cycles. a Single-point Raman data measured after SET and RESET cycles at
the same location, which is 1 µm from the cross-point. The dash lines mark the D, G, and 2D peak,
which will be analyzed in (b−d). b Statistical analysis of D peak drop as a function of switching
cycle. It is observed that the D peak gradually decreases. c The position of G peak as a function of
switching cycle. The G-peak position of the SET is always higher than the RESET in each cycle, and
reversible shifts of G peak position with RRAM programming actions are observed. d The intensity
of 2D peak as a function of switching cycle. The 2D-peak intensity of the SET is always lower than
the RESET in each cycle, and reversible changes of 2D peak intensity with RRAM programming
events are observed. Reprinted from [36]
regroup spontaneously under zero bias because of interfacial energy minimization in Au/SiO x N y :Ag/Au device [37]. The dynamic process of Ag dispersing and
agglomerating is shown in Fig. 7 by in situ TEM.
C. Scanning Probe Analysis
Comparing with the electron microscopy, the novelty of the probe technology is a
mechanical change of the piezoelectric device to precisely control the positioning of
the probe on individual atoms and scan the atoms one by one, so that it provides the
atomic resolved surface analysis based on the principle of van der Waals force [38].
Due to its convenience and reliability, atomic force microscopy (AFM) is regarded as
the leading approach in scanning probe analysis method for thickness measurement
and the layer number counting. Figure 8a shows the typical CAFM experimental
equipment at standard air ambient condition, and the CAFM tip contacts with the
353
Fig. 6 Single-point Raman measurements of SLG during consecutive electrical programming
repeated for nine cycles. a Single-point Raman data measured after SET and RESET cycles at
the same location, which is 1 µm from the cross-point. The dash lines mark the D, G, and 2D peak,
which will be analyzed in (b−d). b Statistical analysis of D peak drop as a function of switching
cycle. It is observed that the D peak gradually decreases. c The position of G peak as a function of
switching cycle. The G-peak position of the SET is always higher than the RESET in each cycle, and
reversible shifts of G peak position with RRAM programming actions are observed. d The intensity
of 2D peak as a function of switching cycle. The 2D-peak intensity of the SET is always lower than
the RESET in each cycle, and reversible changes of 2D peak intensity with RRAM programming
events are observed. Reprinted from [36]
regroup spontaneously under zero bias because of interfacial energy minimization in Au/SiO x N y :Ag/Au device [37]. The dynamic process of Ag dispersing and
agglomerating is shown in Fig. 7 by in situ TEM.
C. Scanning Probe Analysis
Comparing with the electron microscopy, the novelty of the probe technology is a
mechanical change of the piezoelectric device to precisely control the positioning of
the probe on individual atoms and scan the atoms one by one, so that it provides the
atomic resolved surface analysis based on the principle of van der Waals force [38].
Due to its convenience and reliability, atomic force microscopy (AFM) is regarded as
the leading approach in scanning probe analysis method for thickness measurement
and the layer number counting. Figure 8a shows the typical CAFM experimental
equipment at standard air ambient condition, and the CAFM tip contacts with the