

3D Nanomagnetic Logic
273
the Sharrock plot (black line) for the averaged B s0 and E 0 value. The blue quantiles
show the numerical evaluation of the Arrhenius law of Eq. 3.
It is obvious, that for pulse times in the deep sub-micron range below t p ≤ 200 ns
the Sharrock law does not fit the experimental findings. A rather steep increase
of the mean switching field was found, highlighted by the green line as guide for
the eye and not being in good agreement with a fixed parameter set of the Sharrock
equation. However, at that time of the experiment it was attributed to the measurement
setup which showed inaccuracies in the pulse width for short timescale and the
Arrhenius model was in good agreement for medium pulse times, reproducing also
the switching field distributions to a reasonable extent. Nevertheless, the results
were not satisfying and after thorough refinement of the setup, the experiment was
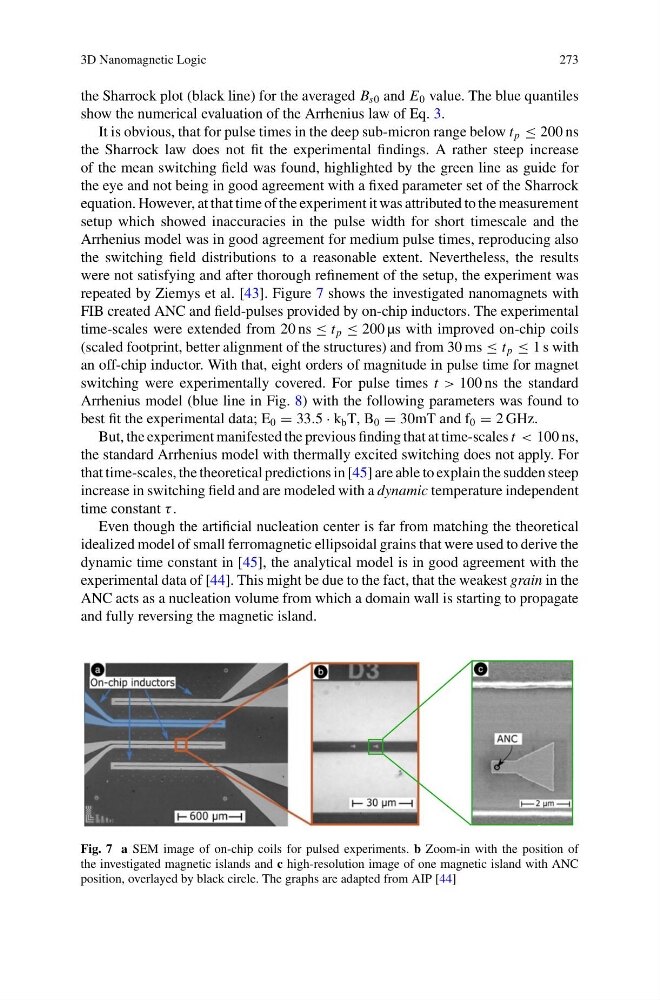
repeated by Ziemys et al. [43]. Figure 7 shows the investigated nanomagnets with
FIB created ANC and field-pulses provided by on-chip inductors. The experimental
time-scales were extended from 20 ns ≤ t p ≤ 200 µs with improved on-chip coils
(scaled footprint, better alignment of the structures) and from 30 ms ≤ t p ≤ 1 s with
an off-chip inductor. With that, eight orders of magnitude in pulse time for magnet
switching were experimentally covered. For pulse times t > 100 ns the standard
Arrhenius model (blue line in Fig. 8) with the following parameters was found to
best fit the experimental data; E 0 = 33.5 · k b T, B 0 = 30mT and f 0 = 2 GHz.
But, the experiment manifested the previous finding that at time-scales t < 100 ns,
the standard Arrhenius model with thermally excited switching does not apply. For
that time-scales, the theoretical predictions in [45] are able to explain the sudden steep
increase in switching field and are modeled with a dynamic temperature independent
time constant τ .
Even though the artificial nucleation center is far from matching the theoretical
idealized model of small ferromagnetic ellipsoidal grains that were used to derive the
dynamic time constant in [45], the analytical model is in good agreement with the
experimental data of [44]. This might be due to the fact, that the weakest grain in the
ANC acts as a nucleation volume from which a domain wall is starting to propagate
and fully reversing the magnetic island.
Fig. 7 a SEM image of on-chip coils for pulsed experiments. b Zoom-in with the position of
the investigated magnetic islands and c high-resolution image of one magnetic island with ANC
position, overlayed by black circle. The graphs are adapted from AIP [44]
273
the Sharrock plot (black line) for the averaged B s0 and E 0 value. The blue quantiles
show the numerical evaluation of the Arrhenius law of Eq. 3.
It is obvious, that for pulse times in the deep sub-micron range below t p ≤ 200 ns
the Sharrock law does not fit the experimental findings. A rather steep increase
of the mean switching field was found, highlighted by the green line as guide for
the eye and not being in good agreement with a fixed parameter set of the Sharrock
equation. However, at that time of the experiment it was attributed to the measurement
setup which showed inaccuracies in the pulse width for short timescale and the
Arrhenius model was in good agreement for medium pulse times, reproducing also
the switching field distributions to a reasonable extent. Nevertheless, the results
were not satisfying and after thorough refinement of the setup, the experiment was
repeated by Ziemys et al. [43]. Figure 7 shows the investigated nanomagnets with
FIB created ANC and field-pulses provided by on-chip inductors. The experimental
time-scales were extended from 20 ns ≤ t p ≤ 200 µs with improved on-chip coils
(scaled footprint, better alignment of the structures) and from 30 ms ≤ t p ≤ 1 s with
an off-chip inductor. With that, eight orders of magnitude in pulse time for magnet
switching were experimentally covered. For pulse times t > 100 ns the standard
Arrhenius model (blue line in Fig. 8) with the following parameters was found to
best fit the experimental data; E 0 = 33.5 · k b T, B 0 = 30mT and f 0 = 2 GHz.
But, the experiment manifested the previous finding that at time-scales t < 100 ns,
the standard Arrhenius model with thermally excited switching does not apply. For
that time-scales, the theoretical predictions in [45] are able to explain the sudden steep
increase in switching field and are modeled with a dynamic temperature independent
time constant τ .
Even though the artificial nucleation center is far from matching the theoretical
idealized model of small ferromagnetic ellipsoidal grains that were used to derive the
dynamic time constant in [45], the analytical model is in good agreement with the
experimental data of [44]. This might be due to the fact, that the weakest grain in the
ANC acts as a nucleation volume from which a domain wall is starting to propagate
and fully reversing the magnetic island.
Fig. 7 a SEM image of on-chip coils for pulsed experiments. b Zoom-in with the position of
the investigated magnetic islands and c high-resolution image of one magnetic island with ANC
position, overlayed by black circle. The graphs are adapted from AIP [44]