

272
M. Becherer
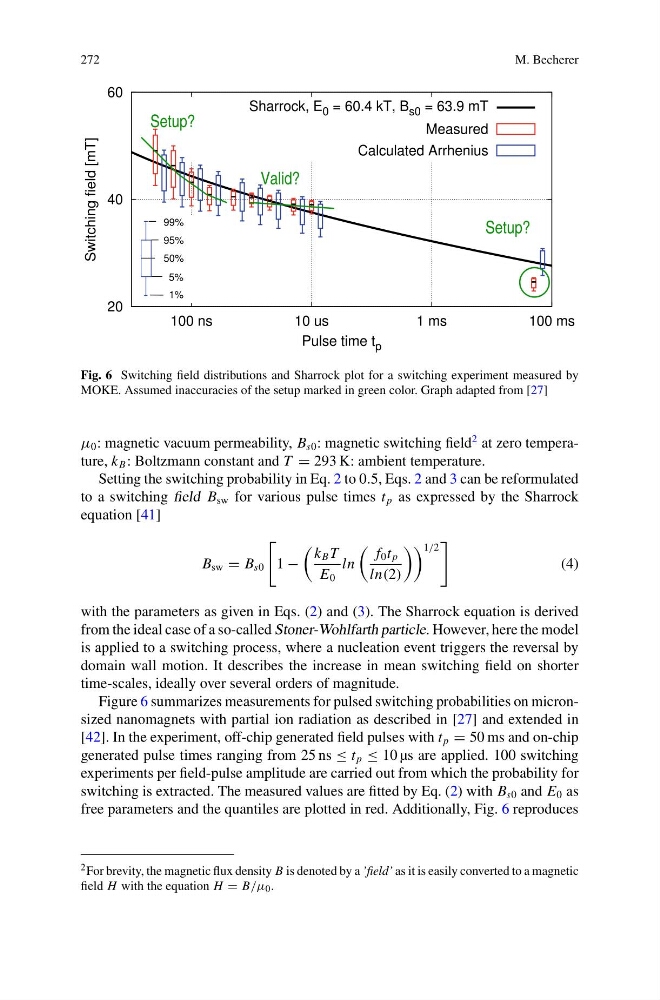
Fig. 6 Switching field distributions and Sharrock plot for a switching experiment measured by
MOKE. Assumed inaccuracies of the setup marked in green color. Graph adapted from [27]
μ 0 : magnetic vacuum permeability, B s0 : magnetic switching field
2 at zero temperature, k B : Boltzmann constant and T = 293 K: ambient temperature.
Setting the switching probability in Eq. 2 to 0.5, Eqs. 2 and 3 can be reformulated
to a switching field B sw for various pulse times t p as expressed by the Sharrock
equation [41]
B sw = B s0
1 −
k B T
E 0
ln
f 0 t p
ln(2)
1/2
(4)
with the parameters as given in Eqs. (2) and (3). The Sharrock equation is derived
from the ideal case of a so-called Stoner-Wohlfarth particle. However, here the model
is applied to a switching process, where a nucleation event triggers the reversal by
domain wall motion. It describes the increase in mean switching field on shorter
time-scales, ideally over several orders of magnitude.
Figure 6 summarizes measurements for pulsed switching probabilities on micronsized nanomagnets with partial ion radiation as described in [27] and extended in
[42]. In the experiment, off-chip generated field pulses with t p = 50 ms and on-chip
generated pulse times ranging from 25 ns ≤ t p ≤ 10 µs are applied. 100 switching
experiments per field-pulse amplitude are carried out from which the probability for
switching is extracted. The measured values are fitted by Eq. (2) with B s0 and E 0 as
free parameters and the quantiles are plotted in red. Additionally, Fig. 6 reproduces
2 For brevity, the magnetic flux density B is denoted by a ’field’ as it is easily converted to a magnetic
field H with the equation H = B/μ 0 .
M. Becherer
Fig. 6 Switching field distributions and Sharrock plot for a switching experiment measured by
MOKE. Assumed inaccuracies of the setup marked in green color. Graph adapted from [27]
μ 0 : magnetic vacuum permeability, B s0 : magnetic switching field
2 at zero temperature, k B : Boltzmann constant and T = 293 K: ambient temperature.
Setting the switching probability in Eq. 2 to 0.5, Eqs. 2 and 3 can be reformulated
to a switching field B sw for various pulse times t p as expressed by the Sharrock
equation [41]
B sw = B s0
1 −
k B T
E 0
ln
f 0 t p
ln(2)
1/2
(4)
with the parameters as given in Eqs. (2) and (3). The Sharrock equation is derived
from the ideal case of a so-called Stoner-Wohlfarth particle. However, here the model
is applied to a switching process, where a nucleation event triggers the reversal by
domain wall motion. It describes the increase in mean switching field on shorter
time-scales, ideally over several orders of magnitude.
Figure 6 summarizes measurements for pulsed switching probabilities on micronsized nanomagnets with partial ion radiation as described in [27] and extended in
[42]. In the experiment, off-chip generated field pulses with t p = 50 ms and on-chip
generated pulse times ranging from 25 ns ≤ t p ≤ 10 µs are applied. 100 switching
experiments per field-pulse amplitude are carried out from which the probability for
switching is extracted. The measured values are fitted by Eq. (2) with B s0 and E 0 as
free parameters and the quantiles are plotted in red. Additionally, Fig. 6 reproduces
2 For brevity, the magnetic flux density B is denoted by a ’field’ as it is easily converted to a magnetic
field H with the equation H = B/μ 0 .