

132
S. Krishnia and W. S. Lew
where A ex is the exchange stiffness, M sat is the saturation magnetization, i is the
separation distance between the two moments, and C i is an arbitrary scaling factor
which determines the strength of the exchange coupling interaction and is equals to
1 for nearest neighbors.
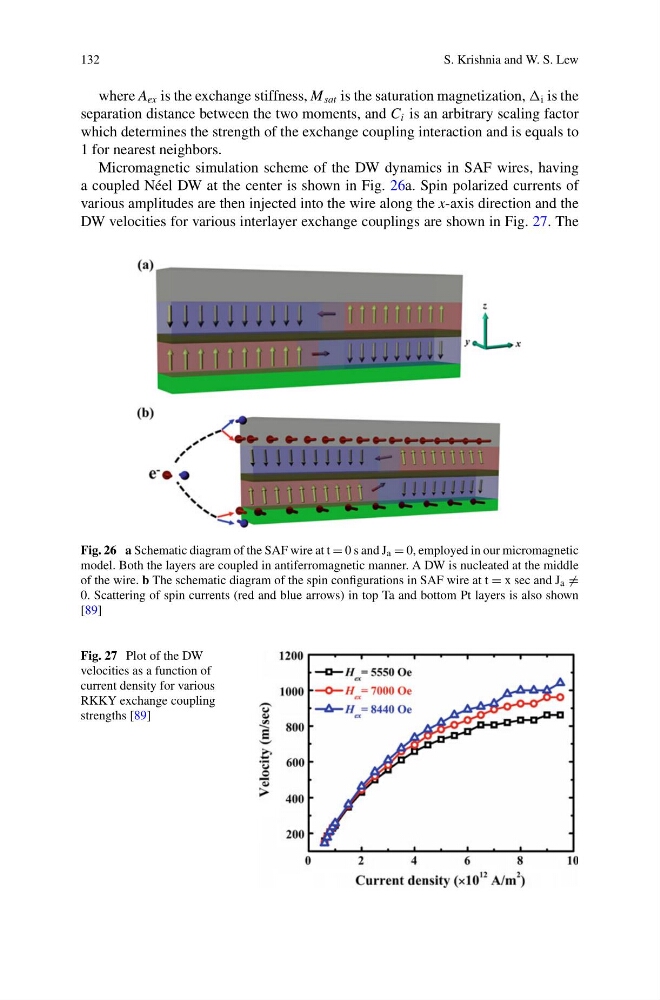
Micromagnetic simulation scheme of the DW dynamics in SAF wires, having
a coupled Néel DW at the center is shown in Fig. 26a. Spin polarized currents of
various amplitudes are then injected into the wire along the x-axis direction and the
DW velocities for various interlayer exchange couplings are shown in Fig. 27. The
Fig. 26 a Schematic diagram of the SAF wire at t = 0 s and J a = 0, employed in our micromagnetic
model. Both the layers are coupled in antiferromagnetic manner. A DW is nucleated at the middle
of the wire. b The schematic diagram of the spin configurations in SAF wire at t = x sec and J a =
0. Scattering of spin currents (red and blue arrows) in top Ta and bottom Pt layers is also shown
[89]
Fig. 27 Plot of the DW
velocities as a function of
current density for various
RKKY exchange coupling
strengths [89]
S. Krishnia and W. S. Lew
where A ex is the exchange stiffness, M sat is the saturation magnetization, i is the
separation distance between the two moments, and C i is an arbitrary scaling factor
which determines the strength of the exchange coupling interaction and is equals to
1 for nearest neighbors.
Micromagnetic simulation scheme of the DW dynamics in SAF wires, having
a coupled Néel DW at the center is shown in Fig. 26a. Spin polarized currents of
various amplitudes are then injected into the wire along the x-axis direction and the
DW velocities for various interlayer exchange couplings are shown in Fig. 27. The
Fig. 26 a Schematic diagram of the SAF wire at t = 0 s and J a = 0, employed in our micromagnetic
model. Both the layers are coupled in antiferromagnetic manner. A DW is nucleated at the middle
of the wire. b The schematic diagram of the spin configurations in SAF wire at t = x sec and J a =
0. Scattering of spin currents (red and blue arrows) in top Ta and bottom Pt layers is also shown
[89]
Fig. 27 Plot of the DW
velocities as a function of
current density for various
RKKY exchange coupling
strengths [89]