

Current-Driven Domain Wall Dynamics in Magnetic …
129
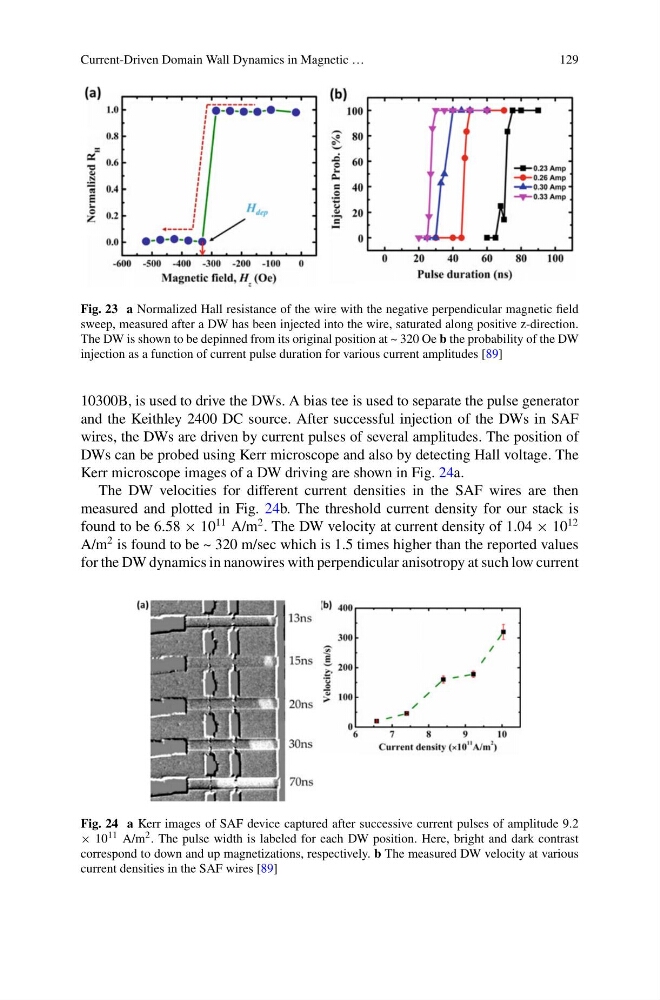
Fig. 23 a Normalized Hall resistance of the wire with the negative perpendicular magnetic field
sweep, measured after a DW has been injected into the wire, saturated along positive z-direction.
The DW is shown to be depinned from its original position at ~ 320 Oe b the probability of the DW
injection as a function of current pulse duration for various current amplitudes [89]
10300B, is used to drive the DWs. A bias tee is used to separate the pulse generator
and the Keithley 2400 DC source. After successful injection of the DWs in SAF
wires, the DWs are driven by current pulses of several amplitudes. The position of
DWs can be probed using Kerr microscope and also by detecting Hall voltage. The
Kerr microscope images of a DW driving are shown in Fig. 24a.
The DW velocities for different current densities in the SAF wires are then
measured and plotted in Fig. 24b. The threshold current density for our stack is
found to be 6.58 × 10
11 A/m
2 . The DW velocity at current density of 1.04 × 10
12
A/m
2 is found to be ~ 320 m/sec which is 1.5 times higher than the reported values
for the DW dynamics in nanowires with perpendicular anisotropy at such low current
Fig. 24 a Kerr images of SAF device captured after successive current pulses of amplitude 9.2
× 10 11 A/m 2 . The pulse width is labeled for each DW position. Here, bright and dark contrast
correspond to down and up magnetizations, respectively. b The measured DW velocity at various
current densities in the SAF wires [89]
129
Fig. 23 a Normalized Hall resistance of the wire with the negative perpendicular magnetic field
sweep, measured after a DW has been injected into the wire, saturated along positive z-direction.
The DW is shown to be depinned from its original position at ~ 320 Oe b the probability of the DW
injection as a function of current pulse duration for various current amplitudes [89]
10300B, is used to drive the DWs. A bias tee is used to separate the pulse generator
and the Keithley 2400 DC source. After successful injection of the DWs in SAF
wires, the DWs are driven by current pulses of several amplitudes. The position of
DWs can be probed using Kerr microscope and also by detecting Hall voltage. The
Kerr microscope images of a DW driving are shown in Fig. 24a.
The DW velocities for different current densities in the SAF wires are then
measured and plotted in Fig. 24b. The threshold current density for our stack is
found to be 6.58 × 10
11 A/m
2 . The DW velocity at current density of 1.04 × 10
12
A/m
2 is found to be ~ 320 m/sec which is 1.5 times higher than the reported values
for the DW dynamics in nanowires with perpendicular anisotropy at such low current
Fig. 24 a Kerr images of SAF device captured after successive current pulses of amplitude 9.2
× 10 11 A/m 2 . The pulse width is labeled for each DW position. Here, bright and dark contrast
correspond to down and up magnetizations, respectively. b The measured DW velocity at various
current densities in the SAF wires [89]