

15
dynamics compare to the observed processes that shape the
tropical Atlantic climate system? In the next subsection, we
first review the basic processes that establish the observed
seasonal cycle in the tropical Atlantic, and then compare the
observations with what is happening in state-of-the-art climate models.
Which Processes Produce the Equatorial
Atlantic Warm Bias?
A good first assumption about the seasonal cycle is that it is
driven by the seasonal movement of the sun. Such a seasonal
cycle should be symmetric. In the tropical Atlantic, however,
it is clearly asymmetric. Figure 6 shows that the cooling
period between April and August is much shorter – or, equivalently, more intense – than the subsequent period of gradual
warming that lasts until the following April. Processes other
than the seasonal forcing of solar insolation must contribute
to the fast growth of the summer cold tongue.
Recent studies of the tropical Atlantic suggest that the
rapid formation of the cold tongue involves a coupled, positive feedback (Keenlyside and Latif 2007; Burls et al. 2011;
Richter et al. 2016). A feedback establishes a relationship
between two or more variables. In a negative feedback small
perturbations in one variable are compensated by changes in
the other such that the system returns to its original, stable
state. The opposite is true for a positive feedback. Here, a
perturbation – even a small one – in one variable provokes
changes in the other variables that reinforce the original perturbation. The system continues to diverge from its initial
state. The perturbation grows until the feedback is disrupted.
The dominant positive feedback in the equatorial oceans
is the Bjerknes feedback (Bjerknes 1969). It relates three key
properties of an equatorial ocean basin to each other: SST in
the eastern ocean basin; zonal wind variability in the western
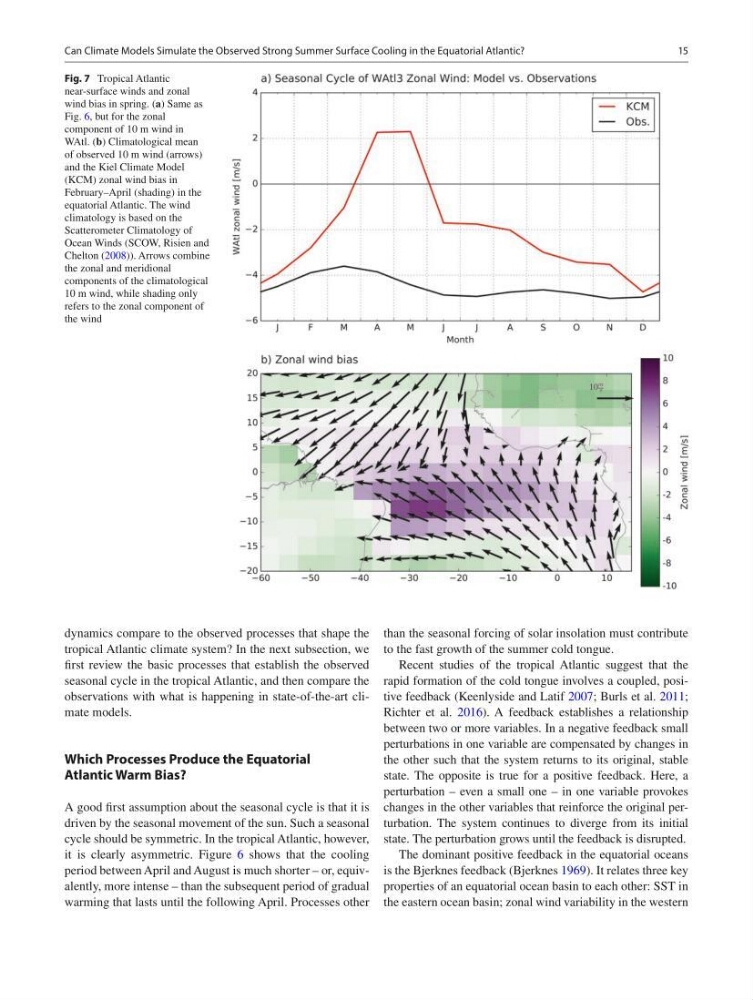
Fig. 7 Tropical Atlantic
near- surface winds and zonal
wind bias in spring. (a) Same as
Fig. 6, but for the zonal
component of 10 m wind in
WAtl. (b) Climatological mean
of observed 10 m wind (arrows)
and the Kiel Climate Model
(KCM) zonal wind bias in
February–April (shading) in the
equatorial Atlantic. The wind
climatology is based on the
Scatterometer Climatology of
Ocean Winds (SCOW, Risien and
Chelton (2008)). Arrows combine
the zonal and meridional
components of the climatological
10 m wind, while shading only
refers to the zonal component of
the wind
Can Climate Models Simulate the Observed Strong Summer Surface Cooling in the Equatorial Atlantic?
dynamics compare to the observed processes that shape the
tropical Atlantic climate system? In the next subsection, we
first review the basic processes that establish the observed
seasonal cycle in the tropical Atlantic, and then compare the
observations with what is happening in state-of-the-art climate models.
Which Processes Produce the Equatorial
Atlantic Warm Bias?
A good first assumption about the seasonal cycle is that it is
driven by the seasonal movement of the sun. Such a seasonal
cycle should be symmetric. In the tropical Atlantic, however,
it is clearly asymmetric. Figure 6 shows that the cooling
period between April and August is much shorter – or, equivalently, more intense – than the subsequent period of gradual
warming that lasts until the following April. Processes other
than the seasonal forcing of solar insolation must contribute
to the fast growth of the summer cold tongue.
Recent studies of the tropical Atlantic suggest that the
rapid formation of the cold tongue involves a coupled, positive feedback (Keenlyside and Latif 2007; Burls et al. 2011;
Richter et al. 2016). A feedback establishes a relationship
between two or more variables. In a negative feedback small
perturbations in one variable are compensated by changes in
the other such that the system returns to its original, stable
state. The opposite is true for a positive feedback. Here, a
perturbation – even a small one – in one variable provokes
changes in the other variables that reinforce the original perturbation. The system continues to diverge from its initial
state. The perturbation grows until the feedback is disrupted.
The dominant positive feedback in the equatorial oceans
is the Bjerknes feedback (Bjerknes 1969). It relates three key
properties of an equatorial ocean basin to each other: SST in
the eastern ocean basin; zonal wind variability in the western
Fig. 7 Tropical Atlantic
near- surface winds and zonal
wind bias in spring. (a) Same as
Fig. 6, but for the zonal
component of 10 m wind in
WAtl. (b) Climatological mean
of observed 10 m wind (arrows)
and the Kiel Climate Model
(KCM) zonal wind bias in
February–April (shading) in the
equatorial Atlantic. The wind
climatology is based on the
Scatterometer Climatology of
Ocean Winds (SCOW, Risien and
Chelton (2008)). Arrows combine
the zonal and meridional
components of the climatological
10 m wind, while shading only
refers to the zonal component of
the wind
Can Climate Models Simulate the Observed Strong Summer Surface Cooling in the Equatorial Atlantic?