

14
along the subtropical western shorelines of all continents.
These biases appear, for example, along the western
US-American as well as the Peruvian and Chilean coasts in
the Pacific, or off Angola and Namibia in the Atlantic. They
are anchored to the eastern boundary upwelling systems,
where cold subsurface waters are brought close to the ocean
surface. Here, SST biases can reach annual mean amplitudes of up to 7 °C in current climate models (Xu et al.
2014).
In this section, we focus on the pronounced warm bias
that covers the equatorial Atlantic cold tongue region. The
annual mean SST bias in the Atl3 region has a magnitude of
approximately 2 °C.
7
In the upper 50 m of Atl3 in the KCM,
this corresponds to a heat surplus of approximately 380 EJ,
an amount of energy that could melt 47 times the ice volume
of the Antarctic ice sheet.
8
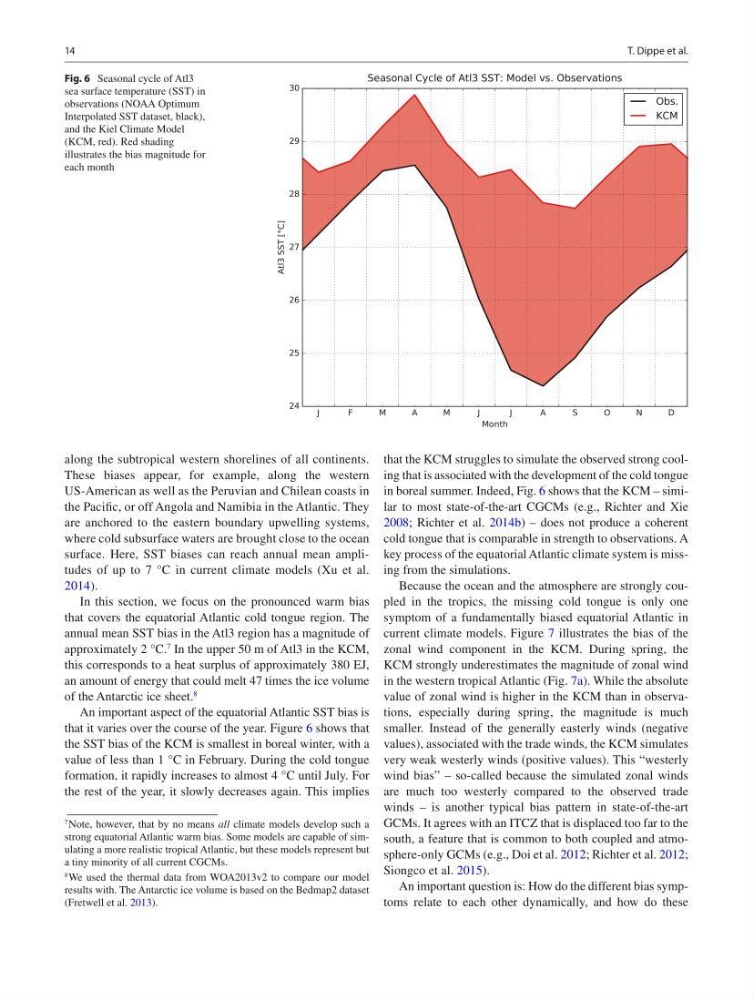
An important aspect of the equatorial Atlantic SST bias is
that it varies over the course of the year. Figure 6 shows that
the SST bias of the KCM is smallest in boreal winter, with a
value of less than 1 °C in February. During the cold tongue
formation, it rapidly increases to almost 4 °C until July. For
the rest of the year, it slowly decreases again. This implies
7 Note, however, that by no means all climate models develop such a
strong equatorial Atlantic warm bias. Some models are capable of simulating a more realistic tropical Atlantic, but these models represent but
a tiny minority of all current CGCMs.
8 We used the thermal data from WOA2013v2 to compare our model
results with. The Antarctic ice volume is based on the Bedmap2 dataset
(Fretwell et al. 2013).
that the KCM struggles to simulate the observed strong cooling that is associated with the development of the cold tongue
in boreal summer. Indeed, Fig. 6 shows that the KCM – similar to most state-of-the-art CGCMs (e.g., Richter and Xie
2008; Richter et al. 2014b) – does not produce a coherent
cold tongue that is comparable in strength to observations. A
key process of the equatorial Atlantic climate system is missing from the simulations.
Because the ocean and the atmosphere are strongly coupled in the tropics, the missing cold tongue is only one
symptom of a fundamentally biased equatorial Atlantic in
current climate models. Figure 7 illustrates the bias of the
zonal wind component in the KCM. During spring, the
KCM strongly underestimates the magnitude of zonal wind
in the western tropical Atlantic (Fig. 7a). While the absolute
value of zonal wind is higher in the KCM than in observations, especially during spring, the magnitude is much
smaller. Instead of the generally easterly winds (negative
values), associated with the trade winds, the KCM simulates
very weak westerly winds (positive values). This “westerly
wind bias” – so-called because the simulated zonal winds
are much too westerly compared to the observed trade
winds – is another typical bias pattern in state-of-the-art
GCMs. It agrees with an ITCZ that is displaced too far to the
south, a feature that is common to both coupled and atmosphere-only GCMs (e.g., Doi et al. 2012; Richter et al. 2012;
Siongco et al. 2015).
An important question is: How do the different bias symptoms relate to each other dynamically, and how do these
Fig. 6 Seasonal cycle of Atl3
sea surface temperature (SST) in
observations (NOAA Optimum
Interpolated SST dataset, black),
and the Kiel Climate Model
(KCM, red). Red shading
illustrates the bias magnitude for
each month
T. Dippe et al.
along the subtropical western shorelines of all continents.
These biases appear, for example, along the western
US-American as well as the Peruvian and Chilean coasts in
the Pacific, or off Angola and Namibia in the Atlantic. They
are anchored to the eastern boundary upwelling systems,
where cold subsurface waters are brought close to the ocean
surface. Here, SST biases can reach annual mean amplitudes of up to 7 °C in current climate models (Xu et al.
2014).
In this section, we focus on the pronounced warm bias
that covers the equatorial Atlantic cold tongue region. The
annual mean SST bias in the Atl3 region has a magnitude of
approximately 2 °C.
7
In the upper 50 m of Atl3 in the KCM,
this corresponds to a heat surplus of approximately 380 EJ,
an amount of energy that could melt 47 times the ice volume
of the Antarctic ice sheet.
8
An important aspect of the equatorial Atlantic SST bias is
that it varies over the course of the year. Figure 6 shows that
the SST bias of the KCM is smallest in boreal winter, with a
value of less than 1 °C in February. During the cold tongue
formation, it rapidly increases to almost 4 °C until July. For
the rest of the year, it slowly decreases again. This implies
7 Note, however, that by no means all climate models develop such a
strong equatorial Atlantic warm bias. Some models are capable of simulating a more realistic tropical Atlantic, but these models represent but
a tiny minority of all current CGCMs.
8 We used the thermal data from WOA2013v2 to compare our model
results with. The Antarctic ice volume is based on the Bedmap2 dataset
(Fretwell et al. 2013).
that the KCM struggles to simulate the observed strong cooling that is associated with the development of the cold tongue
in boreal summer. Indeed, Fig. 6 shows that the KCM – similar to most state-of-the-art CGCMs (e.g., Richter and Xie
2008; Richter et al. 2014b) – does not produce a coherent
cold tongue that is comparable in strength to observations. A
key process of the equatorial Atlantic climate system is missing from the simulations.
Because the ocean and the atmosphere are strongly coupled in the tropics, the missing cold tongue is only one
symptom of a fundamentally biased equatorial Atlantic in
current climate models. Figure 7 illustrates the bias of the
zonal wind component in the KCM. During spring, the
KCM strongly underestimates the magnitude of zonal wind
in the western tropical Atlantic (Fig. 7a). While the absolute
value of zonal wind is higher in the KCM than in observations, especially during spring, the magnitude is much
smaller. Instead of the generally easterly winds (negative
values), associated with the trade winds, the KCM simulates
very weak westerly winds (positive values). This “westerly
wind bias” – so-called because the simulated zonal winds
are much too westerly compared to the observed trade
winds – is another typical bias pattern in state-of-the-art
GCMs. It agrees with an ITCZ that is displaced too far to the
south, a feature that is common to both coupled and atmosphere-only GCMs (e.g., Doi et al. 2012; Richter et al. 2012;
Siongco et al. 2015).
An important question is: How do the different bias symptoms relate to each other dynamically, and how do these
Fig. 6 Seasonal cycle of Atl3
sea surface temperature (SST) in
observations (NOAA Optimum
Interpolated SST dataset, black),
and the Kiel Climate Model
(KCM, red). Red shading
illustrates the bias magnitude for
each month
T. Dippe et al.