

1.1 The Force-Generation
3
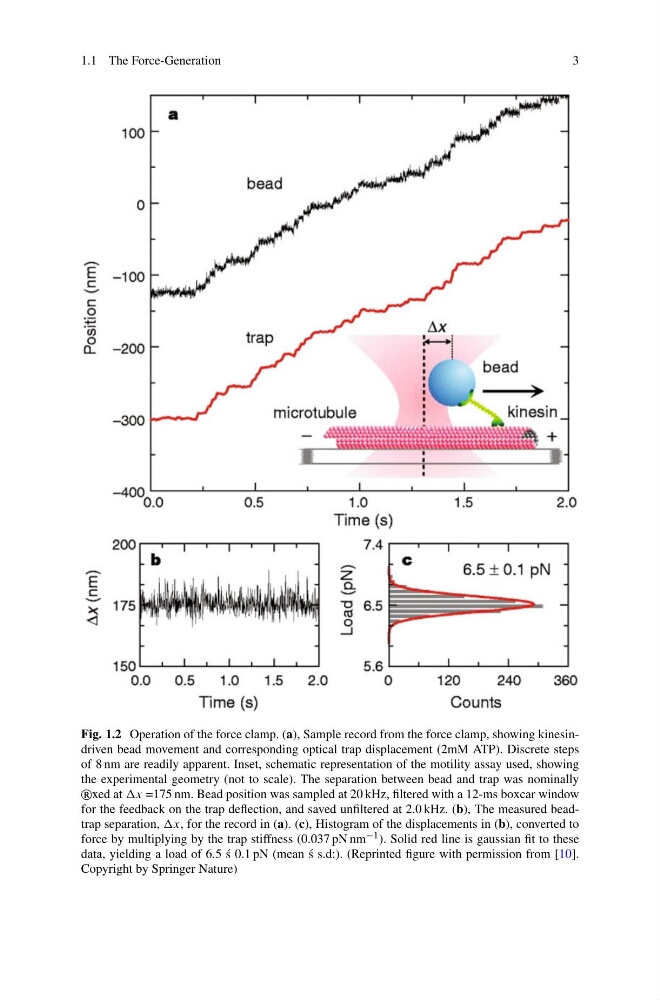
Fig. 1.2 Operation of the force clamp. (a), Sample record from the force clamp, showing kinesindriven bead movement and corresponding optical trap displacement (2mM ATP). Discrete steps
of 8 nm are readily apparent. Inset, schematic representation of the motility assay used, showing
the experimental geometry (not to scale). The separation between bead and trap was nominally
xed at x =175 nm. Bead position was sampled at 20 kHz, filtered with a 12-ms boxcar window
for the feedback on the trap deflection, and saved unfiltered at 2.0 kHz. (b), The measured beadtrap separation, x, for the record in (a). (c), Histogram of the displacements in (b), converted to
force by multiplying by the trap stiffness (0.037 pN nm −1 ). Solid red line is gaussian fit to these
data, yielding a load of 6.5 ´
s 0.1 pN (mean ´
s s.d:). (Reprinted figure with permission from [10].
Copyright by Springer Nature)
3
Fig. 1.2 Operation of the force clamp. (a), Sample record from the force clamp, showing kinesindriven bead movement and corresponding optical trap displacement (2mM ATP). Discrete steps
of 8 nm are readily apparent. Inset, schematic representation of the motility assay used, showing
the experimental geometry (not to scale). The separation between bead and trap was nominally
xed at x =175 nm. Bead position was sampled at 20 kHz, filtered with a 12-ms boxcar window
for the feedback on the trap deflection, and saved unfiltered at 2.0 kHz. (b), The measured beadtrap separation, x, for the record in (a). (c), Histogram of the displacements in (b), converted to
force by multiplying by the trap stiffness (0.037 pN nm −1 ). Solid red line is gaussian fit to these
data, yielding a load of 6.5 ´
s 0.1 pN (mean ´
s s.d:). (Reprinted figure with permission from [10].
Copyright by Springer Nature)