

138
as far back as 1991 spoke about joint responsibility to collaborate and contribute to
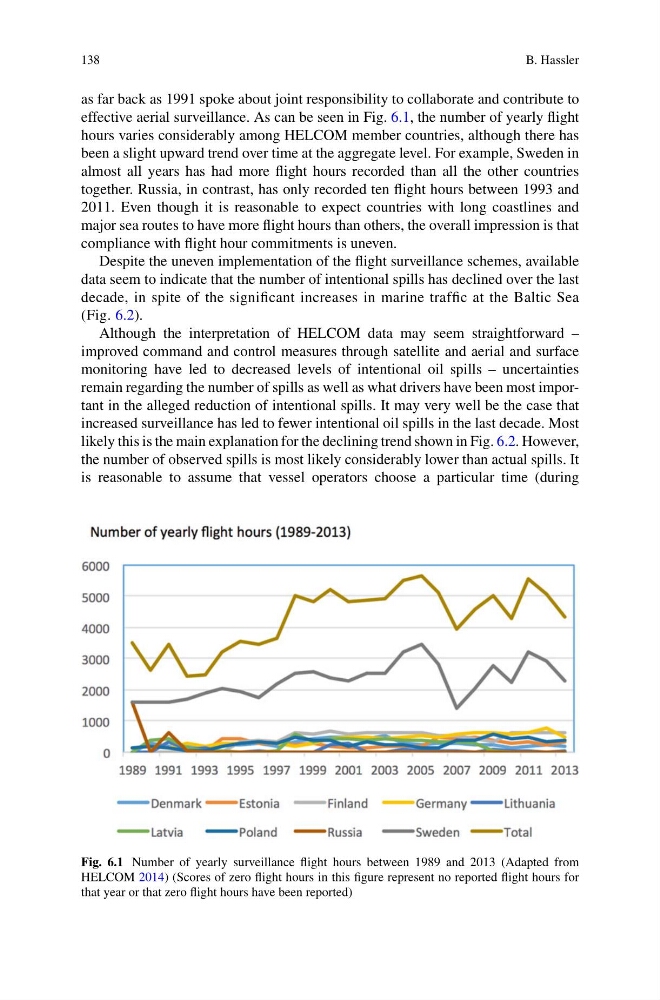
effective aerial surveillance. As can be seen in Fig. 6.1 , the number of yearly fl ight
hours varies considerably among HELCOM member countries, although there has
been a slight upward trend over time at the aggregate level. For example, Sweden in
almost all years has had more fl ight hours recorded than all the other countries
together. Russia, in contrast, has only recorded ten fl ight hours between 1993 and
2011. Even though it is reasonable to expect countries with long coastlines and
major sea routes to have more fl ight hours than others, the overall impression is that
compliance with fl ight hour commitments is uneven.
Despite the uneven implementation of the fl ight surveillance schemes, available
data seem to indicate that the number of intentional spills has declined over the last
decade, in spite of the signifi cant increases in marine traffi c at the Baltic Sea
(Fig. 6.2 ).
Although the interpretation of HELCOM data may seem straightforward –
improved command and control measures through satellite and aerial and surface
monitoring have led to decreased levels of intentional oil spills – uncertainties
remain regarding the number of spills as well as what drivers have been most important in the alleged reduction of intentional spills. It may very well be the case that
increased surveillance has led to fewer intentional oil spills in the last decade. Most
likely this is the main explanation for the declining trend shown in Fig. 6.2 . However,
the number of observed spills is most likely considerably lower than actual spills. It
is reasonable to assume that vessel operators choose a particular time (during
Fig. 6.1 Number of yearly surveillance fl ight hours between 1989 and 2013 (Adapted from
HELCOM 2014 ) (Scores of zero fl ight hours in this fi gure represent no reported fl ight hours for
that year or that zero fl ight hours have been reported)
B. Hassler
as far back as 1991 spoke about joint responsibility to collaborate and contribute to
effective aerial surveillance. As can be seen in Fig. 6.1 , the number of yearly fl ight
hours varies considerably among HELCOM member countries, although there has
been a slight upward trend over time at the aggregate level. For example, Sweden in
almost all years has had more fl ight hours recorded than all the other countries
together. Russia, in contrast, has only recorded ten fl ight hours between 1993 and
2011. Even though it is reasonable to expect countries with long coastlines and
major sea routes to have more fl ight hours than others, the overall impression is that
compliance with fl ight hour commitments is uneven.
Despite the uneven implementation of the fl ight surveillance schemes, available
data seem to indicate that the number of intentional spills has declined over the last
decade, in spite of the signifi cant increases in marine traffi c at the Baltic Sea
(Fig. 6.2 ).
Although the interpretation of HELCOM data may seem straightforward –
improved command and control measures through satellite and aerial and surface
monitoring have led to decreased levels of intentional oil spills – uncertainties
remain regarding the number of spills as well as what drivers have been most important in the alleged reduction of intentional spills. It may very well be the case that
increased surveillance has led to fewer intentional oil spills in the last decade. Most
likely this is the main explanation for the declining trend shown in Fig. 6.2 . However,
the number of observed spills is most likely considerably lower than actual spills. It
is reasonable to assume that vessel operators choose a particular time (during
Fig. 6.1 Number of yearly surveillance fl ight hours between 1989 and 2013 (Adapted from
HELCOM 2014 ) (Scores of zero fl ight hours in this fi gure represent no reported fl ight hours for
that year or that zero fl ight hours have been reported)
B. Hassler