

4.1 Measurements of Jet Substructure Observables
95
were chosen to be z cut = 0.1 and β = 0 (β = 1 and 2 have also been considered in
the ATLAS measurement). The usage of soft drop grooming allows for a comparison of the data with semi-analytical resummation calculations at next-to-leading
order with next-to-leading-logarithm (NLO+NLL) accuracy [238] and leading order
with next-to-next-to-leading-logarithm (LO+NNLL) accuracy [288]. While ATLAS
and CMS use different detector technologies, reconstruction algorithms, calibration
methods, unfolding techniques and simulations, the results are compatible. In both
measurements, uncertainties related to the jet and cluster energy response dominate
the experimental uncertainties with a relative size of about 5%. Uncertainties due to
the QCD modelling are typically between 5–10%, but can be as large as 20% at low
mass where non-perturbative effects are important. The ATLAS measurement [553]
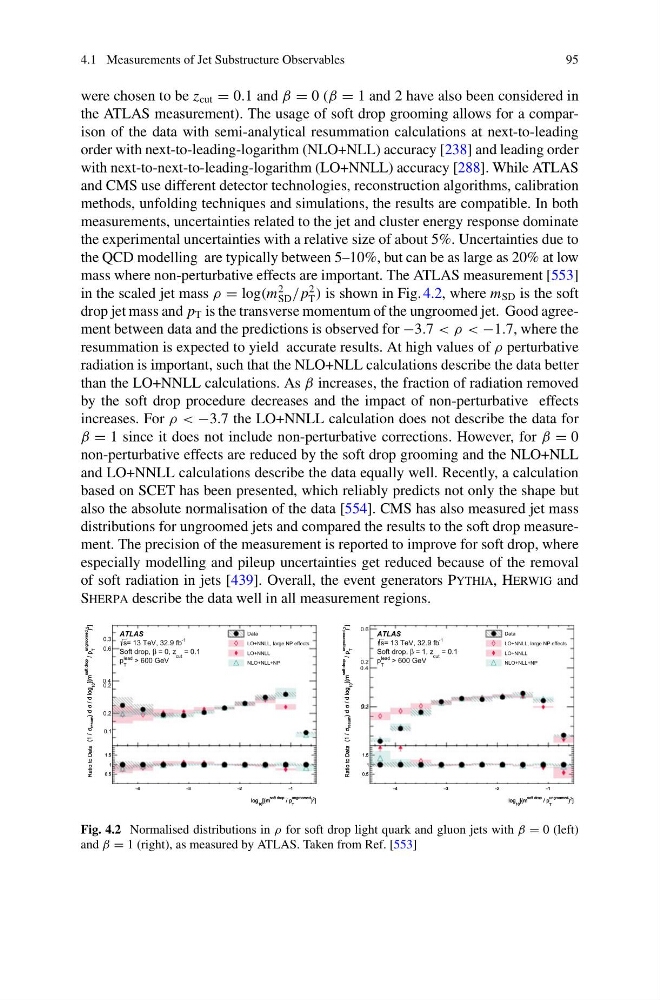
in the scaled jet mass ρ = log(m
2
SD / p
2
T ) is shown in Fig. 4.2, where m SD is the soft
drop jet mass and p T is the transverse momentum of the ungroomed jet. Good agreement between data and the predictions is observed for −3.7 < ρ < −1.7, where the
resummation is expected to yield accurate results. At high values of ρ perturbative
radiation is important, such that the NLO+NLL calculations describe the data better
than the LO+NNLL calculations. As β increases, the fraction of radiation removed
by the soft drop procedure decreases and the impact of non-perturbative effects
increases. For ρ < −3.7 the LO+NNLL calculation does not describe the data for
β = 1 since it does not include non-perturbative corrections. However, for β = 0
non-perturbative effects are reduced by the soft drop grooming and the NLO+NLL
and LO+NNLL calculations describe the data equally well. Recently, a calculation
based on SCET has been presented, which reliably predicts not only the shape but
also the absolute normalisation of the data [554]. CMS has also measured jet mass
distributions for ungroomed jets and compared the results to the soft drop measurement. The precision of the measurement is reported to improve for soft drop, where
especially modelling and pileup uncertainties get reduced because of the removal
of soft radiation in jets [439]. Overall, the event generators Pythia, Herwig and
Sherpa describe the data well in all measurement regions.
0.1
0.2
0.3
]
2
)
ungroomed
T
/ p
soft drop
[(m
10
/ d log
σ
) d
resum
σ
(1 /
4
−
3
−
2
−
1
−
]
2
)
ungroomed
T
/ p
soft drop
[(m
10
log
0.5
1
1.5
Ratio to Data
0.2
0.4
0.6
]
2
)
ungroomed
T
/ p
soft drop
[(m
10
/ d log
σ
) d
resum
σ
(1 /
ATLAS
-1
= 13 TeV, 32.9 fb
s
= 0.1
cut
= 0, z
β
Soft drop,
> 600 GeV
lead
T
p
4
−
3
−
2
−
1
−
]
2
)
ungroomed
T
/ p
soft drop
[(m
10
log
0.5
1
1.5
Ratio to Data
Data
LO+NNLL, large NP effects
LO+NNLL
NLO+NLL+NP
0.1
0.2
]
2
)
ungroomed
T
/ p
soft drop
[(m
10
/ d log
σ
) d
resum
σ
(1 /
4
−
3
−
2
−
1
−
]
2
)
ungroomed
T
/ p
soft drop
[(m
10
log
0.5
1
1.5
Ratio to Data
0.2
0.4
0.6
]
2
)
ungroomed
T
/ p
soft drop
[(m
10
/ d log
σ
) d
resum
σ
(1 /
ATLAS
-1
= 13 TeV, 32.9 fb
s
= 0.1
cut
= 1, z
β
Soft drop,
> 600 GeV
lead
T
p
4
−
3
−
2
−
1
−
]
2
)
ungroomed
T
/ p
soft drop
[(m
10
log
0.5
1
1.5
Ratio to Data
Data
LO+NNLL, large NP effects
LO+NNLL
NLO+NLL+NP
Fig. 4.2 Normalised distributions in ρ for soft drop light quark and gluon jets with β = 0 (left)
and β = 1 (right), as measured by ATLAS. Taken from Ref. [553]
95
were chosen to be z cut = 0.1 and β = 0 (β = 1 and 2 have also been considered in
the ATLAS measurement). The usage of soft drop grooming allows for a comparison of the data with semi-analytical resummation calculations at next-to-leading
order with next-to-leading-logarithm (NLO+NLL) accuracy [238] and leading order
with next-to-next-to-leading-logarithm (LO+NNLL) accuracy [288]. While ATLAS
and CMS use different detector technologies, reconstruction algorithms, calibration
methods, unfolding techniques and simulations, the results are compatible. In both
measurements, uncertainties related to the jet and cluster energy response dominate
the experimental uncertainties with a relative size of about 5%. Uncertainties due to
the QCD modelling are typically between 5–10%, but can be as large as 20% at low
mass where non-perturbative effects are important. The ATLAS measurement [553]
in the scaled jet mass ρ = log(m
2
SD / p
2
T ) is shown in Fig. 4.2, where m SD is the soft
drop jet mass and p T is the transverse momentum of the ungroomed jet. Good agreement between data and the predictions is observed for −3.7 < ρ < −1.7, where the
resummation is expected to yield accurate results. At high values of ρ perturbative
radiation is important, such that the NLO+NLL calculations describe the data better
than the LO+NNLL calculations. As β increases, the fraction of radiation removed
by the soft drop procedure decreases and the impact of non-perturbative effects
increases. For ρ < −3.7 the LO+NNLL calculation does not describe the data for
β = 1 since it does not include non-perturbative corrections. However, for β = 0
non-perturbative effects are reduced by the soft drop grooming and the NLO+NLL
and LO+NNLL calculations describe the data equally well. Recently, a calculation
based on SCET has been presented, which reliably predicts not only the shape but
also the absolute normalisation of the data [554]. CMS has also measured jet mass
distributions for ungroomed jets and compared the results to the soft drop measurement. The precision of the measurement is reported to improve for soft drop, where
especially modelling and pileup uncertainties get reduced because of the removal
of soft radiation in jets [439]. Overall, the event generators Pythia, Herwig and
Sherpa describe the data well in all measurement regions.
0.1
0.2
0.3
]
2
)
ungroomed
T
/ p
soft drop
[(m
10
/ d log
σ
) d
resum
σ
(1 /
4
−
3
−
2
−
1
−
]
2
)
ungroomed
T
/ p
soft drop
[(m
10
log
0.5
1
1.5
Ratio to Data
0.2
0.4
0.6
]
2
)
ungroomed
T
/ p
soft drop
[(m
10
/ d log
σ
) d
resum
σ
(1 /
ATLAS
-1
= 13 TeV, 32.9 fb
s
= 0.1
cut
= 0, z
β
Soft drop,
> 600 GeV
lead
T
p
4
−
3
−
2
−
1
−
]
2
)
ungroomed
T
/ p
soft drop
[(m
10
log
0.5
1
1.5
Ratio to Data
Data
LO+NNLL, large NP effects
LO+NNLL
NLO+NLL+NP
0.1
0.2
]
2
)
ungroomed
T
/ p
soft drop
[(m
10
/ d log
σ
) d
resum
σ
(1 /
4
−
3
−
2
−
1
−
]
2
)
ungroomed
T
/ p
soft drop
[(m
10
log
0.5
1
1.5
Ratio to Data
0.2
0.4
0.6
]
2
)
ungroomed
T
/ p
soft drop
[(m
10
/ d log
σ
) d
resum
σ
(1 /
ATLAS
-1
= 13 TeV, 32.9 fb
s
= 0.1
cut
= 1, z
β
Soft drop,
> 600 GeV
lead
T
p
4
−
3
−
2
−
1
−
]
2
)
ungroomed
T
/ p
soft drop
[(m
10
log
0.5
1
1.5
Ratio to Data
Data
LO+NNLL, large NP effects
LO+NNLL
NLO+NLL+NP
Fig. 4.2 Normalised distributions in ρ for soft drop light quark and gluon jets with β = 0 (left)
and β = 1 (right), as measured by ATLAS. Taken from Ref. [553]