

67
According to the definition (Malça and Freire 2006), if the NRE consumption
ratio is less than 1, it means that the fuel is renewable. On the other hand, if the ratio
is larger than 1, more fossil energy is required to make the fuel than the energy
available in the final fuel product. Thus, the fuel is classified as nonrenewable.
The life cycle inventories of the WTT part reflect the GHG emission and NRE
consumption during the production stage. The results suggest that the baseline ethanol production pathway saves GHG emissions and NRE expenditure even without
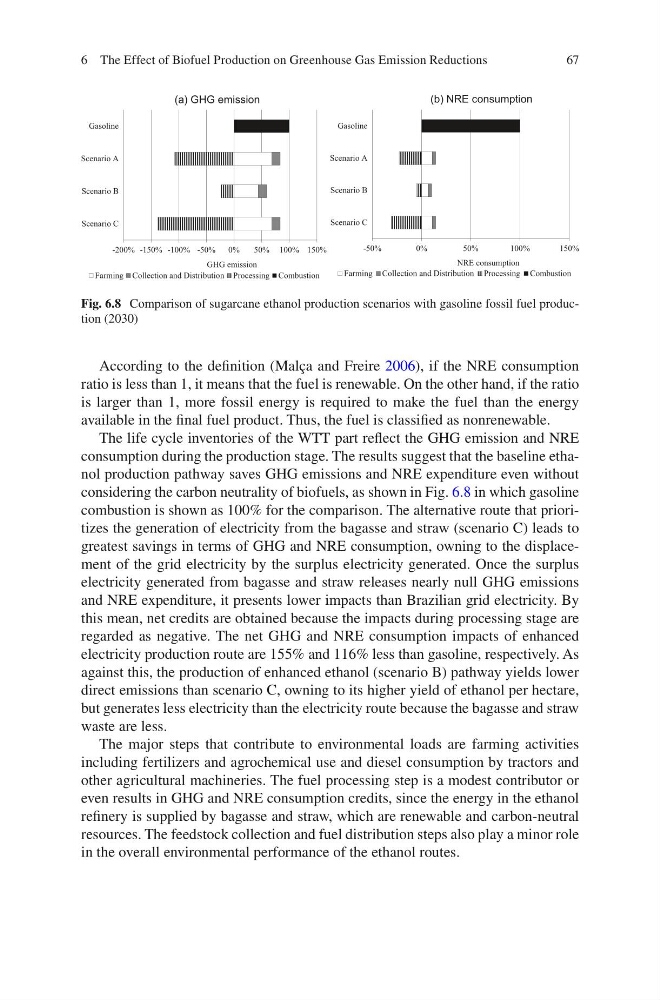
considering the carbon neutrality of biofuels, as shown in Fig. 6.8 in which gasoline
combustion is shown as 100% for the comparison. The alternative route that prioritizes the generation of electricity from the bagasse and straw (scenario C) leads to
greatest savings in terms of GHG and NRE consumption, owning to the displacement of the grid electricity by the surplus electricity generated. Once the surplus
electricity generated from bagasse and straw releases nearly null GHG emissions
and NRE expenditure, it presents lower impacts than Brazilian grid electricity. By
this mean, net credits are obtained because the impacts during processing stage are
regarded as negative. The net GHG and NRE consumption impacts of enhanced
electricity production route are 155% and 116% less than gasoline, respectively. As
against this, the production of enhanced ethanol (scenario B) pathway yields lower
direct emissions than scenario C, owning to its higher yield of ethanol per hectare,
but generates less electricity than the electricity route because the bagasse and straw
waste are less.
The major steps that contribute to environmental loads are farming activities
including fertilizers and agrochemical use and diesel consumption by tractors and
other agricultural machineries. The fuel processing step is a modest contributor or
even results in GHG and NRE consumption credits, since the energy in the ethanol
refinery is supplied by bagasse and straw, which are renewable and carbon-neutral
resources. The feedstock collection and fuel distribution steps also play a minor role
in the overall environmental performance of the ethanol routes.
-200% -150% -100% -50%
0%
50% 100% 150%
Scenario C
Scenario B
Scenario A
Gasoline
GHG emission
Farming Collection and Distribution Processing Combustion
-50%
0%
50%
1 00%
1 50%
Scenario C
Scenario B
Scenario A
Gasoline
NRE consumption
Farming Collection and Distribution Processing Combustion
(a) GHG emission
(b) NRE consumption
Fig. 6.8 Comparison of sugarcane ethanol production scenarios with gasoline fossil fuel production (2030)
6 The Effect of Biofuel Production on Greenhouse Gas Emission Reductions
According to the definition (Malça and Freire 2006), if the NRE consumption
ratio is less than 1, it means that the fuel is renewable. On the other hand, if the ratio
is larger than 1, more fossil energy is required to make the fuel than the energy
available in the final fuel product. Thus, the fuel is classified as nonrenewable.
The life cycle inventories of the WTT part reflect the GHG emission and NRE
consumption during the production stage. The results suggest that the baseline ethanol production pathway saves GHG emissions and NRE expenditure even without
considering the carbon neutrality of biofuels, as shown in Fig. 6.8 in which gasoline
combustion is shown as 100% for the comparison. The alternative route that prioritizes the generation of electricity from the bagasse and straw (scenario C) leads to
greatest savings in terms of GHG and NRE consumption, owning to the displacement of the grid electricity by the surplus electricity generated. Once the surplus
electricity generated from bagasse and straw releases nearly null GHG emissions
and NRE expenditure, it presents lower impacts than Brazilian grid electricity. By
this mean, net credits are obtained because the impacts during processing stage are
regarded as negative. The net GHG and NRE consumption impacts of enhanced
electricity production route are 155% and 116% less than gasoline, respectively. As
against this, the production of enhanced ethanol (scenario B) pathway yields lower
direct emissions than scenario C, owning to its higher yield of ethanol per hectare,
but generates less electricity than the electricity route because the bagasse and straw
waste are less.
The major steps that contribute to environmental loads are farming activities
including fertilizers and agrochemical use and diesel consumption by tractors and
other agricultural machineries. The fuel processing step is a modest contributor or
even results in GHG and NRE consumption credits, since the energy in the ethanol
refinery is supplied by bagasse and straw, which are renewable and carbon-neutral
resources. The feedstock collection and fuel distribution steps also play a minor role
in the overall environmental performance of the ethanol routes.
-200% -150% -100% -50%
0%
50% 100% 150%
Scenario C
Scenario B
Scenario A
Gasoline
GHG emission
Farming Collection and Distribution Processing Combustion
-50%
0%
50%
1 00%
1 50%
Scenario C
Scenario B
Scenario A
Gasoline
NRE consumption
Farming Collection and Distribution Processing Combustion
(a) GHG emission
(b) NRE consumption
Fig. 6.8 Comparison of sugarcane ethanol production scenarios with gasoline fossil fuel production (2030)
6 The Effect of Biofuel Production on Greenhouse Gas Emission Reductions