

68
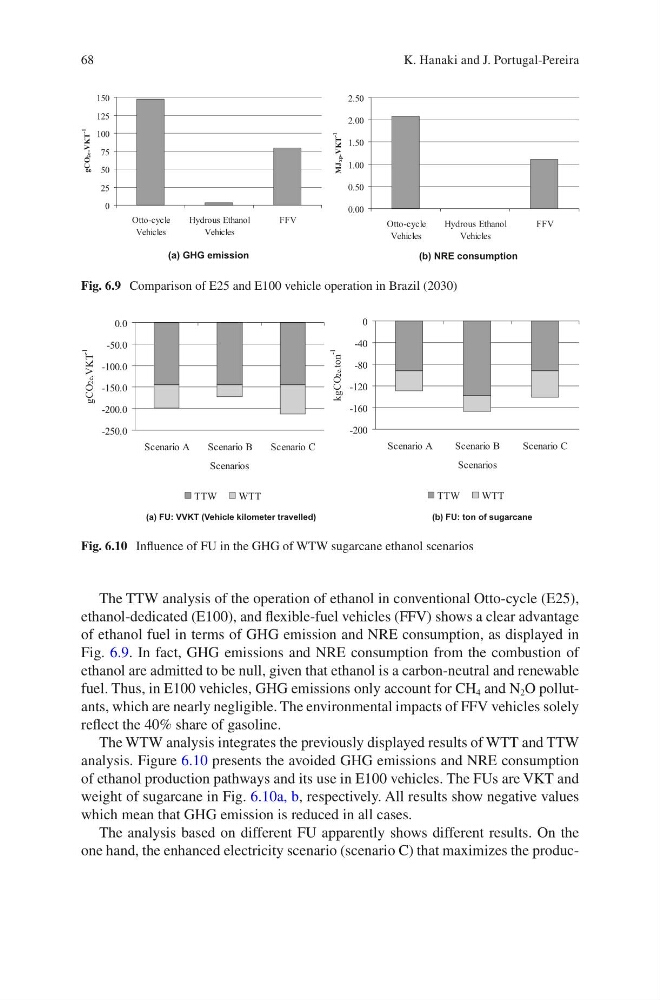
The TTW analysis of the operation of ethanol in conventional Otto-cycle (E25),
ethanol-dedicated (E100), and flexible-fuel vehicles (FFV) shows a clear advantage
of ethanol fuel in terms of GHG emission and NRE consumption, as displayed in
Fig. 6.9. In fact, GHG emissions and NRE consumption from the combustion of
ethanol are admitted to be null, given that ethanol is a carbon-neutral and renewable
fuel. Thus, in E100 vehicles, GHG emissions only account for CH 4 and N 2 O pollutants, which are nearly negligible. The environmental impacts of FFV vehicles solely
reflect the 40% share of gasoline.
The WTW analysis integrates the previously displayed results of WTT and TTW
analysis. Figure 6.10 presents the avoided GHG emissions and NRE consumption
of ethanol production pathways and its use in E100 vehicles. The FUs are VKT and
weight of sugarcane in Fig. 6.10a, b, respectively. All results show negative values
which mean that GHG emission is reduced in all cases.
The analysis based on different FU apparently shows different results. On the
one hand, the enhanced electricity scenario (scenario C) that maximizes the produc(a) GHG emission
(b) NRE consumption
0
25
50
75
100
125
150
Otto-cycle
Vehicles
Hydrous Ethanol
Vehicles
FFV
gCO2e.VKT
-1
0.00
0.50
1.00
1.50
2.00
2.50
Otto-cycle
Vehicles
Hydrous Ethanol
Vehicles
FFV
MJxp.VKT
-1
Fig. 6.9 Comparison of E25 and E100 vehicle operation in Brazil (2030)
-250.0
-200.0
-150.0
-100.0
-50.0
0.0
Scenario A
Scenario B
Scenario C
Scenarios
gCO2e.VKT
-1
TTW
WTT
-200
-160
-120
-80
-40
0
Scenario A
Scenario B
S cenario C
Scenarios
kgCO2e.ton
-1
TTW
WTT
(a) FU: VVKT (Vehicle kilometer travelled)
(b) FU: ton of sugarcane
Fig. 6.10 Influence of FU in the GHG of WTW sugarcane ethanol scenarios
K. Hanaki and J. Portugal-Pereira
The TTW analysis of the operation of ethanol in conventional Otto-cycle (E25),
ethanol-dedicated (E100), and flexible-fuel vehicles (FFV) shows a clear advantage
of ethanol fuel in terms of GHG emission and NRE consumption, as displayed in
Fig. 6.9. In fact, GHG emissions and NRE consumption from the combustion of
ethanol are admitted to be null, given that ethanol is a carbon-neutral and renewable
fuel. Thus, in E100 vehicles, GHG emissions only account for CH 4 and N 2 O pollutants, which are nearly negligible. The environmental impacts of FFV vehicles solely
reflect the 40% share of gasoline.
The WTW analysis integrates the previously displayed results of WTT and TTW
analysis. Figure 6.10 presents the avoided GHG emissions and NRE consumption
of ethanol production pathways and its use in E100 vehicles. The FUs are VKT and
weight of sugarcane in Fig. 6.10a, b, respectively. All results show negative values
which mean that GHG emission is reduced in all cases.
The analysis based on different FU apparently shows different results. On the
one hand, the enhanced electricity scenario (scenario C) that maximizes the produc(a) GHG emission
(b) NRE consumption
0
25
50
75
100
125
150
Otto-cycle
Vehicles
Hydrous Ethanol
Vehicles
FFV
gCO2e.VKT
-1
0.00
0.50
1.00
1.50
2.00
2.50
Otto-cycle
Vehicles
Hydrous Ethanol
Vehicles
FFV
MJxp.VKT
-1
Fig. 6.9 Comparison of E25 and E100 vehicle operation in Brazil (2030)
-250.0
-200.0
-150.0
-100.0
-50.0
0.0
Scenario A
Scenario B
Scenario C
Scenarios
gCO2e.VKT
-1
TTW
WTT
-200
-160
-120
-80
-40
0
Scenario A
Scenario B
S cenario C
Scenarios
kgCO2e.ton
-1
TTW
WTT
(a) FU: VVKT (Vehicle kilometer travelled)
(b) FU: ton of sugarcane
Fig. 6.10 Influence of FU in the GHG of WTW sugarcane ethanol scenarios
K. Hanaki and J. Portugal-Pereira