

43
5.4.2 Detailed Procedures
Benefits for corn producers and corn consumers are evaluated as producers’ surplus
and consumers’ surplus, respectively. Supply function and demand function are
necessary to calculate surplus in each country.
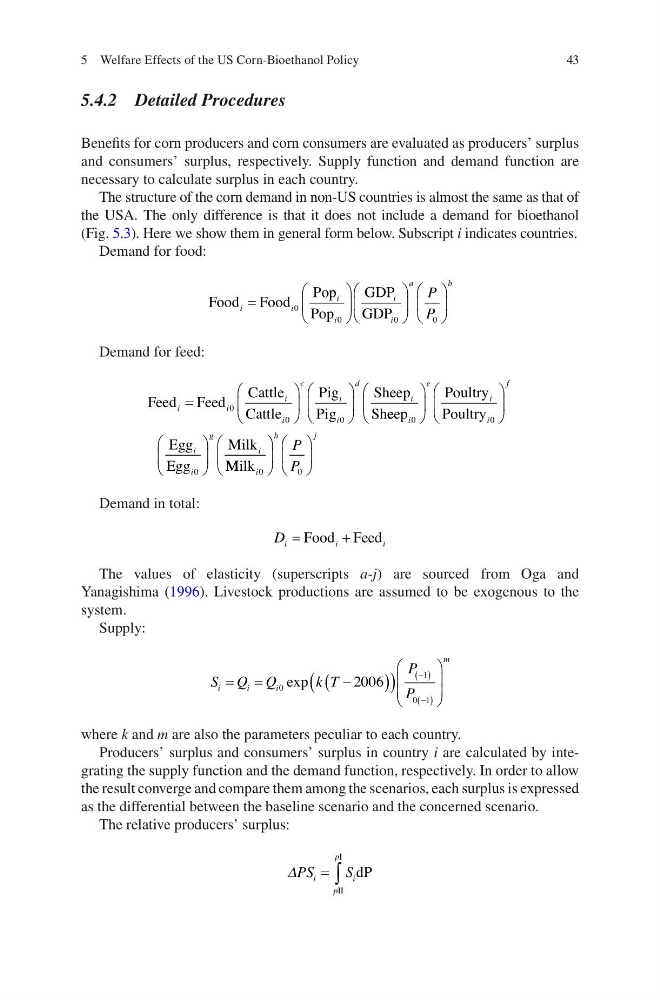
The structure of the corn demand in non-US countries is almost the same as that of
the USA. The only difference is that it does not include a demand for bioethanol
(Fig. 5.3). Here we show them in general form below. Subscript i indicates countries.
Demand for food:
Food Food
Pop
Pop
GDP
GDP
i
i
i
i
i
i
a
b
P
P
=
æ
è
ç
ö
ø
÷
æ
è
ç
ö
ø
÷
æ
è
ç
ö
ø
÷
0
0
0
0
Demand for feed:
Feed Feed
Cattle
Cattle
Pig
Pig
Sheep
Sh
i
i
i
i
c
i
i
d
i
=
æ
è
ç
ö
ø
÷
æ
è
ç
ö
ø
÷
0
0
0
e eep
Poultry
Poultry
Egg
Egg
Milk
i
e
i
i
f
i
i
g
i
0
0
0
æ
è
ç
ö
ø
÷
æ
è
ç
ö
ø
÷
æ
è
ç
ö
ø
÷ M Milk i
h
j
P
P
0
0
æ
è
ç
ö
ø
÷
æ
è
ç
ö
ø
÷
Demand in total:
D i
i
i
=
+
Food Feed
The values of elasticity (superscripts a-j) are sourced from Oga and
Yanagishima (1996). Livestock productions are assumed to be exogenous to the
system.
Supply:
S Q Q
k T
P
P
i
i
i
m
= =
-
(
)
(
)
æ
è
ç
ç
ö
ø
÷
÷
-
( )
-
( )
0
1
0 1
2006
exp
where k and m are also the parameters peculiar to each country.
Producers’ surplus and consumers’ surplus in country i are calculated by integrating the supply function and the demand function, respectively. In order to allow
the result converge and compare them among the scenarios, each surplus is expressed
as the differential between the baseline scenario and the concerned scenario.
The relative producers’ surplus:
DPS
S
i
p
p
i
= ò
II
I
dP
5 Welfare Effects of the US Corn-Bioethanol Policy
5.4.2 Detailed Procedures
Benefits for corn producers and corn consumers are evaluated as producers’ surplus
and consumers’ surplus, respectively. Supply function and demand function are
necessary to calculate surplus in each country.
The structure of the corn demand in non-US countries is almost the same as that of
the USA. The only difference is that it does not include a demand for bioethanol
(Fig. 5.3). Here we show them in general form below. Subscript i indicates countries.
Demand for food:
Food Food
Pop
Pop
GDP
GDP
i
i
i
i
i
i
a
b
P
P
=
æ
è
ç
ö
ø
÷
æ
è
ç
ö
ø
÷
æ
è
ç
ö
ø
÷
0
0
0
0
Demand for feed:
Feed Feed
Cattle
Cattle
Pig
Pig
Sheep
Sh
i
i
i
i
c
i
i
d
i
=
æ
è
ç
ö
ø
÷
æ
è
ç
ö
ø
÷
0
0
0
e eep
Poultry
Poultry
Egg
Egg
Milk
i
e
i
i
f
i
i
g
i
0
0
0
æ
è
ç
ö
ø
÷
æ
è
ç
ö
ø
÷
æ
è
ç
ö
ø
÷ M Milk i
h
j
P
P
0
0
æ
è
ç
ö
ø
÷
æ
è
ç
ö
ø
÷
Demand in total:
D i
i
i
=
+
Food Feed
The values of elasticity (superscripts a-j) are sourced from Oga and
Yanagishima (1996). Livestock productions are assumed to be exogenous to the
system.
Supply:
S Q Q
k T
P
P
i
i
i
m
= =
-
(
)
(
)
æ
è
ç
ç
ö
ø
÷
÷
-
( )
-
( )
0
1
0 1
2006
exp
where k and m are also the parameters peculiar to each country.
Producers’ surplus and consumers’ surplus in country i are calculated by integrating the supply function and the demand function, respectively. In order to allow
the result converge and compare them among the scenarios, each surplus is expressed
as the differential between the baseline scenario and the concerned scenario.
The relative producers’ surplus:
DPS
S
i
p
p
i
= ò
II
I
dP
5 Welfare Effects of the US Corn-Bioethanol Policy