

41
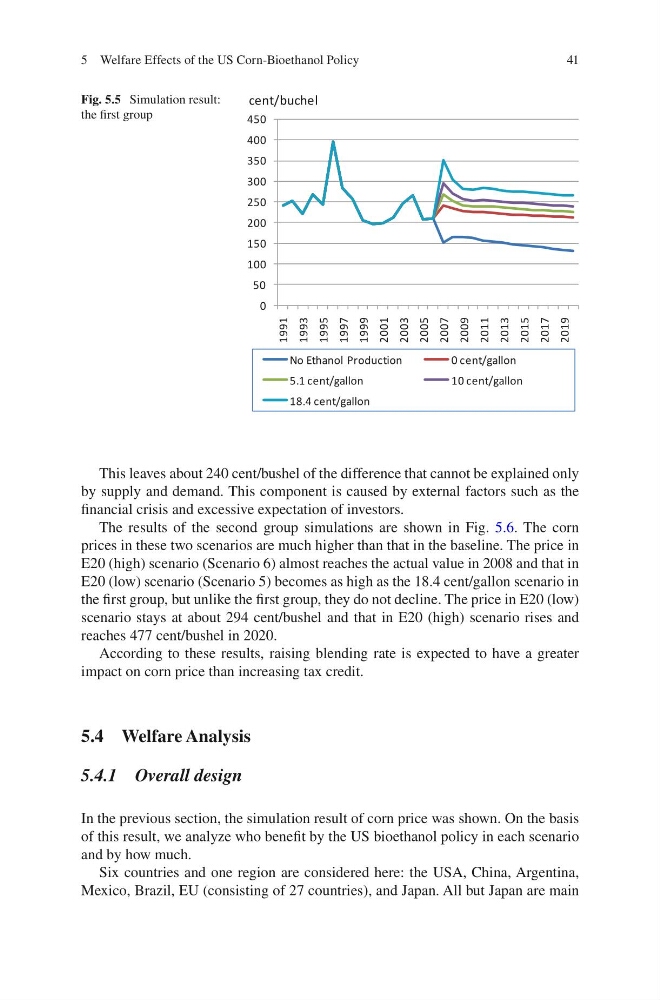
This leaves about 240 cent/bushel of the difference that cannot be explained only
by supply and demand. This component is caused by external factors such as the
financial crisis and excessive expectation of investors.
The results of the second group simulations are shown in Fig. 5.6. The corn
prices in these two scenarios are much higher than that in the baseline. The price in
E20 (high) scenario (Scenario 6) almost reaches the actual value in 2008 and that in
E20 (low) scenario (Scenario 5) becomes as high as the 18.4 cent/gallon scenario in
the first group, but unlike the first group, they do not decline. The price in E20 (low)
scenario stays at about 294 cent/bushel and that in E20 (high) scenario rises and
reaches 477 cent/bushel in 2020.
According to these results, raising blending rate is expected to have a greater
impact on corn price than increasing tax credit.
5.4 Welfare Analysis
5.4.1 Overall design
In the previous section, the simulation result of corn price was shown. On the basis
of this result, we analyze who benefit by the US bioethanol policy in each scenario
and by how much.
Six countries and one region are considered here: the USA, China, Argentina,
Mexico, Brazil, EU (consisting of 27 countries), and Japan. All but Japan are main
0
50
100
150
200
250
300
350
400
450
1991
1993
1995
1997
1999
2001
2003
2005
2007
2009
2011
2013
2015
2017
2019
No Ethanol Production
0 cent/gallon
5.1 cent/gallon
10 cent/gallon
18.4 cent/gallon
cent/buchel
Fig. 5.5 Simulation result:
the first group
5 Welfare Effects of the US Corn-Bioethanol Policy
This leaves about 240 cent/bushel of the difference that cannot be explained only
by supply and demand. This component is caused by external factors such as the
financial crisis and excessive expectation of investors.
The results of the second group simulations are shown in Fig. 5.6. The corn
prices in these two scenarios are much higher than that in the baseline. The price in
E20 (high) scenario (Scenario 6) almost reaches the actual value in 2008 and that in
E20 (low) scenario (Scenario 5) becomes as high as the 18.4 cent/gallon scenario in
the first group, but unlike the first group, they do not decline. The price in E20 (low)
scenario stays at about 294 cent/bushel and that in E20 (high) scenario rises and
reaches 477 cent/bushel in 2020.
According to these results, raising blending rate is expected to have a greater
impact on corn price than increasing tax credit.
5.4 Welfare Analysis
5.4.1 Overall design
In the previous section, the simulation result of corn price was shown. On the basis
of this result, we analyze who benefit by the US bioethanol policy in each scenario
and by how much.
Six countries and one region are considered here: the USA, China, Argentina,
Mexico, Brazil, EU (consisting of 27 countries), and Japan. All but Japan are main
0
50
100
150
200
250
300
350
400
450
1991
1993
1995
1997
1999
2001
2003
2005
2007
2009
2011
2013
2015
2017
2019
No Ethanol Production
0 cent/gallon
5.1 cent/gallon
10 cent/gallon
18.4 cent/gallon
cent/buchel
Fig. 5.5 Simulation result:
the first group
5 Welfare Effects of the US Corn-Bioethanol Policy