

39
5.3.2 Scenarios
We arranged two types of scenarios. The first group consists of the baseline and four
scenarios in which the tax credit is shifted as shown.
Baseline: taxcredit = 5.1 cent/E10 gallon (actual value in 2008)
Scenario 1: No Ethanol Production (NEP)
Scenario 2: taxcredit = 0 cent/E10 gallon
Scenario 3: taxcredit = 10 cent/E10 gallon
Scenario 4: taxcredit = 18.4 cent/E10 gallon (totally offsets the current federal
fuel tax)
The policies in Scenarios 1 and 2 are expected to result in less bioethanol production than the baseline level, whereas those in Scenarios 3 and 4 are expected to
result in reverse.
The second group of scenarios consists of the baseline and two scenarios in
which E10 is replaced with E20. There is a crucial assumption here; the parameters
in the bioethanol demand function (5.7) remains unchanged even if the blending
rate has changed.
Baseline: taxcredit = 5.1 cent/E10 gallon (actual value in 2008)
Scenario 5: consumers select gasoline or E20 (low)
Scanario 6: consumers select gasoline or E20 (high)
Tax credit is 10.2 cent/E20gallon in both Scenarios 5 and 6. This is because taxcredit is a variable indicating the tax credit for E10. In other words, taxcredit = 5.1
means the tax credit for ethanol is 51 cent/gallon. If this rate is fixed, the one for E20
equals to 10.2 cent/gallon.
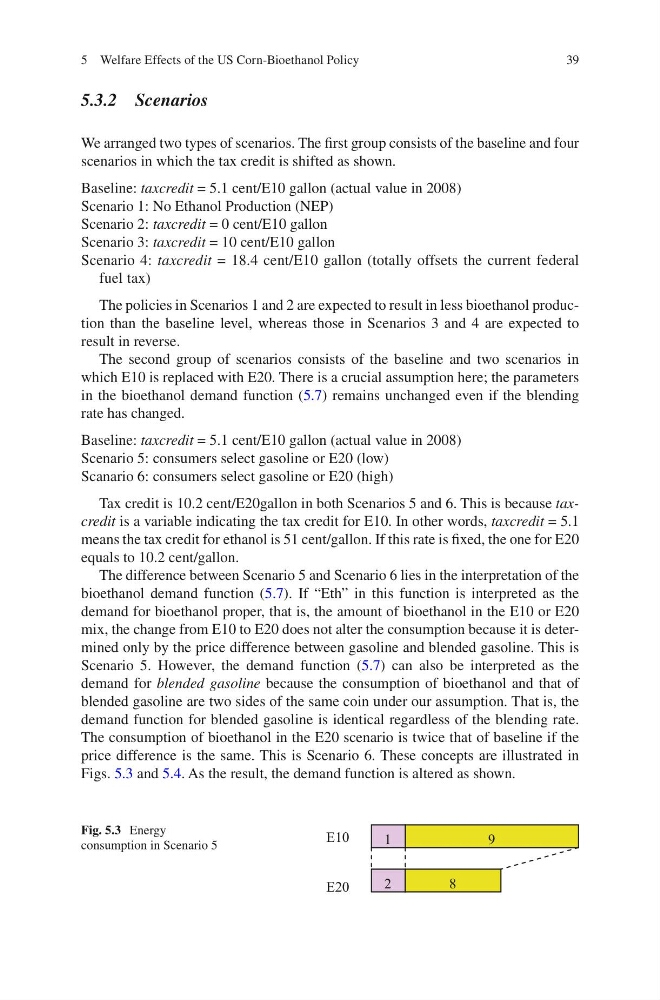
The difference between Scenario 5 and Scenario 6 lies in the interpretation of the
bioethanol demand function (5.7). If “Eth” in this function is interpreted as the
demand for bioethanol proper, that is, the amount of bioethanol in the E10 or E20
mix, the change from E10 to E20 does not alter the consumption because it is determined only by the price difference between gasoline and blended gasoline. This is
Scenario 5. However, the demand function (5.7) can also be interpreted as the
demand for blended gasoline because the consumption of bioethanol and that of
blended gasoline are two sides of the same coin under our assumption. That is, the
demand function for blended gasoline is identical regardless of the blending rate.
The consumption of bioethanol in the E20 scenario is twice that of baseline if the
price difference is the same. This is Scenario 6. These concepts are illustrated in
Figs. 5.3 and 5.4. As the result, the demand function is altered as shown.
9
1
E10
E20
2
8
Fig. 5.3 Energy
consumption in Scenario 5
5 Welfare Effects of the US Corn-Bioethanol Policy
5.3.2 Scenarios
We arranged two types of scenarios. The first group consists of the baseline and four
scenarios in which the tax credit is shifted as shown.
Baseline: taxcredit = 5.1 cent/E10 gallon (actual value in 2008)
Scenario 1: No Ethanol Production (NEP)
Scenario 2: taxcredit = 0 cent/E10 gallon
Scenario 3: taxcredit = 10 cent/E10 gallon
Scenario 4: taxcredit = 18.4 cent/E10 gallon (totally offsets the current federal
fuel tax)
The policies in Scenarios 1 and 2 are expected to result in less bioethanol production than the baseline level, whereas those in Scenarios 3 and 4 are expected to
result in reverse.
The second group of scenarios consists of the baseline and two scenarios in
which E10 is replaced with E20. There is a crucial assumption here; the parameters
in the bioethanol demand function (5.7) remains unchanged even if the blending
rate has changed.
Baseline: taxcredit = 5.1 cent/E10 gallon (actual value in 2008)
Scenario 5: consumers select gasoline or E20 (low)
Scanario 6: consumers select gasoline or E20 (high)
Tax credit is 10.2 cent/E20gallon in both Scenarios 5 and 6. This is because taxcredit is a variable indicating the tax credit for E10. In other words, taxcredit = 5.1
means the tax credit for ethanol is 51 cent/gallon. If this rate is fixed, the one for E20
equals to 10.2 cent/gallon.
The difference between Scenario 5 and Scenario 6 lies in the interpretation of the
bioethanol demand function (5.7). If “Eth” in this function is interpreted as the
demand for bioethanol proper, that is, the amount of bioethanol in the E10 or E20
mix, the change from E10 to E20 does not alter the consumption because it is determined only by the price difference between gasoline and blended gasoline. This is
Scenario 5. However, the demand function (5.7) can also be interpreted as the
demand for blended gasoline because the consumption of bioethanol and that of
blended gasoline are two sides of the same coin under our assumption. That is, the
demand function for blended gasoline is identical regardless of the blending rate.
The consumption of bioethanol in the E20 scenario is twice that of baseline if the
price difference is the same. This is Scenario 6. These concepts are illustrated in
Figs. 5.3 and 5.4. As the result, the demand function is altered as shown.
9
1
E10
E20
2
8
Fig. 5.3 Energy
consumption in Scenario 5
5 Welfare Effects of the US Corn-Bioethanol Policy