

35
Farmers determine whether they cultivate corn or soybean before planting. If
soybean price is relatively high and farmers expect soybean is more profitable, they
plant soybean instead of corn. As a result, harvested area of corn will reduce.
Similarly, demand for corn is also affected by wheat price because corn as feed can
be substituted by wheat. We do not consider fluctuations of their prices to simplify
the model’s structure and interpretation of the result of our study. In this model, corn
price is determined solely by US domestic supply and demand, and behavior of
producers and consumers in other countries are not reflected in the price. Import is
omitted from the model because it has been less than 0.22% of production since
1961 (FAOstat n.d.).
5.2.2 Detailed Model Structure
Equations are either estimated using data published by USDA (n.d.-a) and FAOstat
(n.d.) or cited from Oga and Yanagishima (1996).
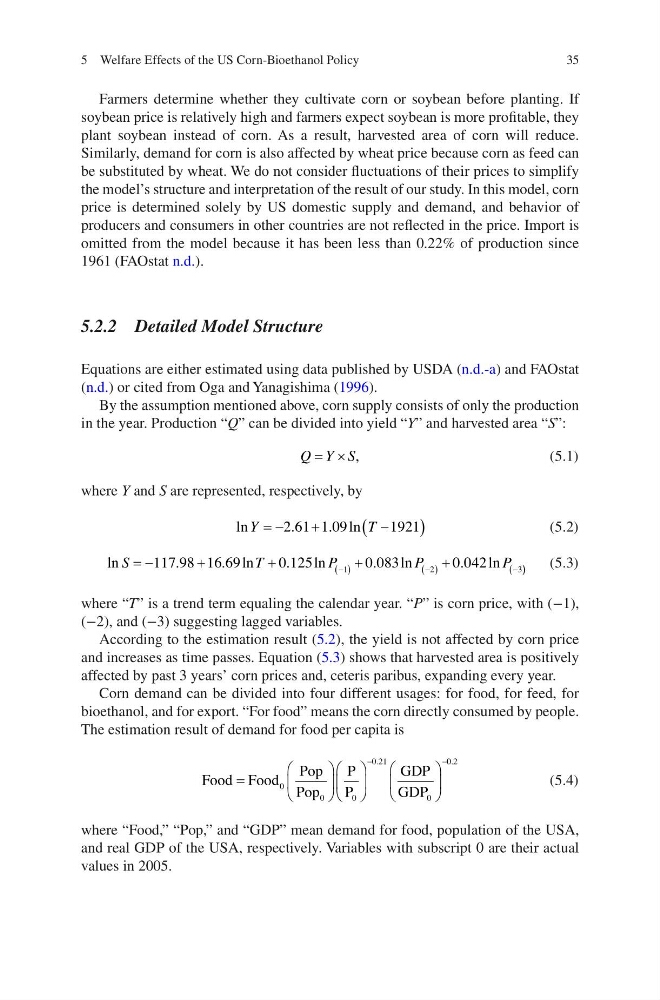
By the assumption mentioned above, corn supply consists of only the production
in the year. Production “Q” can be divided into yield “Y” and harvested area “S”:
Q Y S
= ´ ,
(5.1)
where Y and S are represented, respectively, by
ln
.
. ln
Y
T
= -
+
-
(
)
2 61 1 09
1921
(5.2)
ln
.
. ln
.
ln
.
ln
.
ln
S
T
P
P
P
= -
+
+
+
+
-
( )
-
( )
-
(
117 98 16 69
0 125
0 083
0 042
1
2
3) )
(5.3)
where “T” is a trend term equaling the calendar year. “P” is corn price, with (−1),
(−2), and (−3) suggesting lagged variables.
According to the estimation result (5.2), the yield is not affected by corn price
and increases as time passes. Equation (5.3) shows that harvested area is positively
affected by past 3 years’ corn prices and, ceteris paribus, expanding every year.
Corn demand can be divided into four different usages: for food, for feed, for
bioethanol, and for export. “For food” means the corn directly consumed by people.
The estimation result of demand for food per capita is
Food Food
Pop
Pop
P
P
GDP
GDP
=
æ
è
ç
ö
ø
÷
æ
è
ç
ö
ø
÷
æ
è
ç
ö
ø
÷
-
-
0
0
0
0 21
0
0 2
.
.
(5.4)
where “Food,” “Pop,” and “GDP” mean demand for food, population of the USA,
and real GDP of the USA, respectively. Variables with subscript 0 are their actual
values in 2005.
5 Welfare Effects of the US Corn-Bioethanol Policy
Farmers determine whether they cultivate corn or soybean before planting. If
soybean price is relatively high and farmers expect soybean is more profitable, they
plant soybean instead of corn. As a result, harvested area of corn will reduce.
Similarly, demand for corn is also affected by wheat price because corn as feed can
be substituted by wheat. We do not consider fluctuations of their prices to simplify
the model’s structure and interpretation of the result of our study. In this model, corn
price is determined solely by US domestic supply and demand, and behavior of
producers and consumers in other countries are not reflected in the price. Import is
omitted from the model because it has been less than 0.22% of production since
1961 (FAOstat n.d.).
5.2.2 Detailed Model Structure
Equations are either estimated using data published by USDA (n.d.-a) and FAOstat
(n.d.) or cited from Oga and Yanagishima (1996).
By the assumption mentioned above, corn supply consists of only the production
in the year. Production “Q” can be divided into yield “Y” and harvested area “S”:
Q Y S
= ´ ,
(5.1)
where Y and S are represented, respectively, by
ln
.
. ln
Y
T
= -
+
-
(
)
2 61 1 09
1921
(5.2)
ln
.
. ln
.
ln
.
ln
.
ln
S
T
P
P
P
= -
+
+
+
+
-
( )
-
( )
-
(
117 98 16 69
0 125
0 083
0 042
1
2
3) )
(5.3)
where “T” is a trend term equaling the calendar year. “P” is corn price, with (−1),
(−2), and (−3) suggesting lagged variables.
According to the estimation result (5.2), the yield is not affected by corn price
and increases as time passes. Equation (5.3) shows that harvested area is positively
affected by past 3 years’ corn prices and, ceteris paribus, expanding every year.
Corn demand can be divided into four different usages: for food, for feed, for
bioethanol, and for export. “For food” means the corn directly consumed by people.
The estimation result of demand for food per capita is
Food Food
Pop
Pop
P
P
GDP
GDP
=
æ
è
ç
ö
ø
÷
æ
è
ç
ö
ø
÷
æ
è
ç
ö
ø
÷
-
-
0
0
0
0 21
0
0 2
.
.
(5.4)
where “Food,” “Pop,” and “GDP” mean demand for food, population of the USA,
and real GDP of the USA, respectively. Variables with subscript 0 are their actual
values in 2005.
5 Welfare Effects of the US Corn-Bioethanol Policy