

36
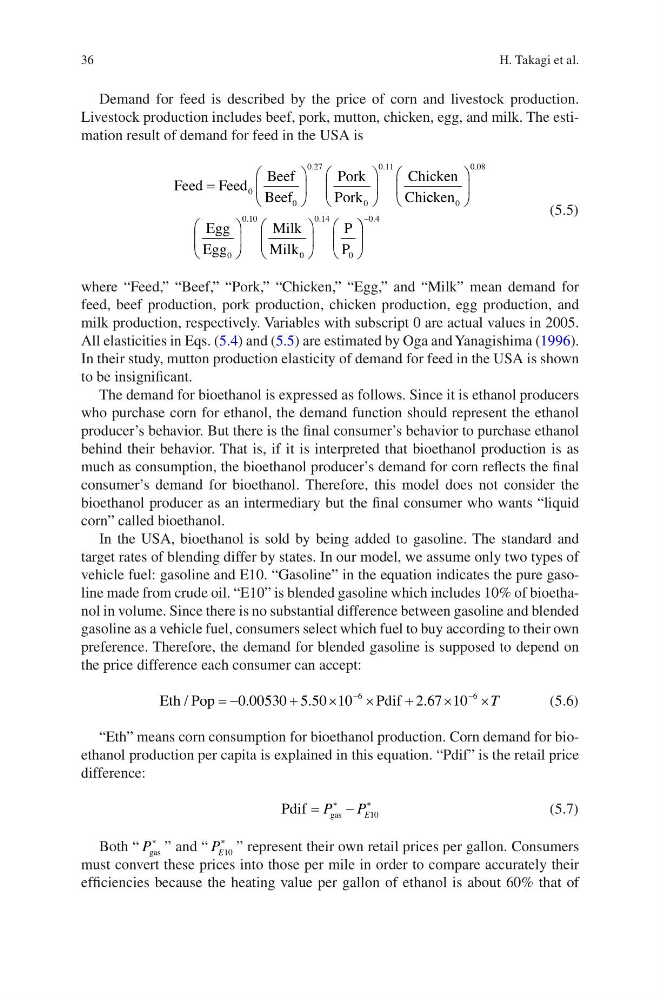
Demand for feed is described by the price of corn and livestock production.
Livestock production includes beef, pork, mutton, chicken, egg, and milk. The estimation result of demand for feed in the USA is
Feed Feed
Beef
Beef
Pork
Pork
Chicken
Chi
=
æ
è
ç
ö
ø
÷
æ
è
ç
ö
ø
÷
0
0
0 27
0
0 11
.
.
c cken
Egg
Egg
Milk
Milk
P
P
0
0 08
0
0 10
0
0 14
0
æ
è
ç
ö
ø
÷
æ
è
ç
ö
ø
÷
æ
è
ç
ö
ø
÷
æ
è
ç
.
.
.
ö ö
ø
÷
-0 4
.
(5.5)
where “Feed,” “Beef,” “Pork,” “Chicken,” “Egg,” and “Milk” mean demand for
feed, beef production, pork production, chicken production, egg production, and
milk production, respectively. Variables with subscript 0 are actual values in 2005.
All elasticities in Eqs. (5.4) and (5.5) are estimated by Oga and Yanagishima (1996).
In their study, mutton production elasticity of demand for feed in the USA is shown
to be insignificant.
The demand for bioethanol is expressed as follows. Since it is ethanol producers
who purchase corn for ethanol, the demand function should represent the ethanol
producer’s behavior. But there is the final consumer’s behavior to purchase ethanol
behind their behavior. That is, if it is interpreted that bioethanol production is as
much as consumption, the bioethanol producer’s demand for corn reflects the final
consumer’s demand for bioethanol. Therefore, this model does not consider the
bioethanol producer as an intermediary but the final consumer who wants “liquid
corn” called bioethanol.
In the USA, bioethanol is sold by being added to gasoline. The standard and
target rates of blending differ by states. In our model, we assume only two types of
vehicle fuel: gasoline and E10. “Gasoline” in the equation indicates the pure gasoline made from crude oil. “E10” is blended gasoline which includes 10% of bioethanol in volume. Since there is no substantial difference between gasoline and blended
gasoline as a vehicle fuel, consumers select which fuel to buy according to their own
preference. Therefore, the demand for blended gasoline is supposed to depend on
the price difference each consumer can accept:
Eth Pop
Pdif
/
.
.
.
= -
+
´
´
+
´
´
-
-
0 00530 5 50 10
267 10
6
6
T
(5.6)
“Eth” means corn consumption for bioethanol production. Corn demand for bioethanol production per capita is explained in this equation. “Pdif” is the retail price
difference:
Pdif
gas
=
-
*
*
P
P E10
(5.7)
Both “ P gas
* ” and “ P E10
* ” represent their own retail prices per gallon. Consumers
must convert these prices into those per mile in order to compare accurately their
efficiencies because the heating value per gallon of ethanol is about 60% that of
H. Takagi et al.
Demand for feed is described by the price of corn and livestock production.
Livestock production includes beef, pork, mutton, chicken, egg, and milk. The estimation result of demand for feed in the USA is
Feed Feed
Beef
Beef
Pork
Pork
Chicken
Chi
=
æ
è
ç
ö
ø
÷
æ
è
ç
ö
ø
÷
0
0
0 27
0
0 11
.
.
c cken
Egg
Egg
Milk
Milk
P
P
0
0 08
0
0 10
0
0 14
0
æ
è
ç
ö
ø
÷
æ
è
ç
ö
ø
÷
æ
è
ç
ö
ø
÷
æ
è
ç
.
.
.
ö ö
ø
÷
-0 4
.
(5.5)
where “Feed,” “Beef,” “Pork,” “Chicken,” “Egg,” and “Milk” mean demand for
feed, beef production, pork production, chicken production, egg production, and
milk production, respectively. Variables with subscript 0 are actual values in 2005.
All elasticities in Eqs. (5.4) and (5.5) are estimated by Oga and Yanagishima (1996).
In their study, mutton production elasticity of demand for feed in the USA is shown
to be insignificant.
The demand for bioethanol is expressed as follows. Since it is ethanol producers
who purchase corn for ethanol, the demand function should represent the ethanol
producer’s behavior. But there is the final consumer’s behavior to purchase ethanol
behind their behavior. That is, if it is interpreted that bioethanol production is as
much as consumption, the bioethanol producer’s demand for corn reflects the final
consumer’s demand for bioethanol. Therefore, this model does not consider the
bioethanol producer as an intermediary but the final consumer who wants “liquid
corn” called bioethanol.
In the USA, bioethanol is sold by being added to gasoline. The standard and
target rates of blending differ by states. In our model, we assume only two types of
vehicle fuel: gasoline and E10. “Gasoline” in the equation indicates the pure gasoline made from crude oil. “E10” is blended gasoline which includes 10% of bioethanol in volume. Since there is no substantial difference between gasoline and blended
gasoline as a vehicle fuel, consumers select which fuel to buy according to their own
preference. Therefore, the demand for blended gasoline is supposed to depend on
the price difference each consumer can accept:
Eth Pop
Pdif
/
.
.
.
= -
+
´
´
+
´
´
-
-
0 00530 5 50 10
267 10
6
6
T
(5.6)
“Eth” means corn consumption for bioethanol production. Corn demand for bioethanol production per capita is explained in this equation. “Pdif” is the retail price
difference:
Pdif
gas
=
-
*
*
P
P E10
(5.7)
Both “ P gas
* ” and “ P E10
* ” represent their own retail prices per gallon. Consumers
must convert these prices into those per mile in order to compare accurately their
efficiencies because the heating value per gallon of ethanol is about 60% that of
H. Takagi et al.