

37
Ensemble Mean (EM) of climate change projections of: winter(DJF), spring (MAM),
summer (JJA) and autumn (SON) maximum temperature -Bologna
station; Scenario A1B (2021:2050-1961:1990)-output of SDs
EM_djf 2021-2050
Climate_djf 1961-1990
Climate_mam 1961-1990
Climate_jja 1961-1990
Climate_son_1961-1990
EM_mam 2021-2050
EM_jja 2021-2050
EM_son_2021-2050
-8
-7
-6
-5
-4
-3
-2
-1
0
1
2
3
4
5
6
7
∆T(°C)
8
Probability Density Function
0.0
0.1
0.2
0.3
0.4
0.5
0.6
0.7
0.8
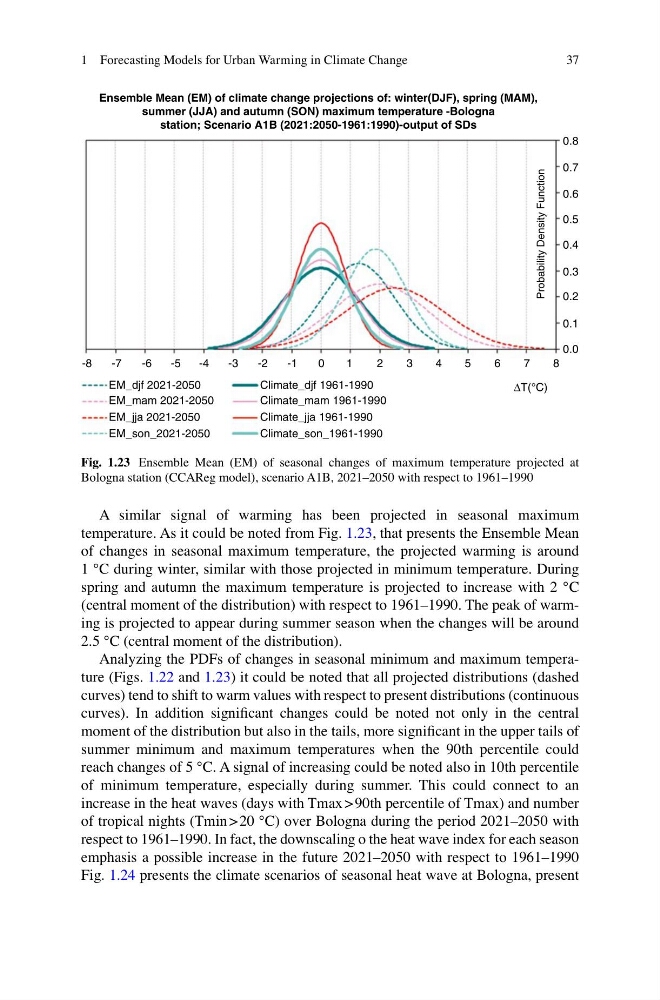
Fig. 1.23 Ensemble Mean (EM) of seasonal changes of maximum temperature projected at
Bologna station (CCAReg model), scenario A1B, 2021–2050 with respect to 1961–1990
A similar signal of warming has been projected in seasonal maximum
temperature. As it could be noted from Fig. 1.23, that presents the Ensemble Mean
of changes in seasonal maximum temperature, the projected warming is around
1 °C during winter, similar with those projected in minimum temperature. During
spring and autumn the maximum temperature is projected to increase with 2 °C
(central moment of the distribution) with respect to 1961–1990. The peak of warming is projected to appear during summer season when the changes will be around
2.5 °C (central moment of the distribution).
Analyzing the PDFs of changes in seasonal minimum and maximum temperature (Figs. 1.22 and 1.23) it could be noted that all projected distributions (dashed
curves) tend to shift to warm values with respect to present distributions (continuous
curves). In addition significant changes could be noted not only in the central
moment of the distribution but also in the tails, more significant in the upper tails of
summer minimum and maximum temperatures when the 90th percentile could
reach changes of 5 °C. A signal of increasing could be noted also in 10th percentile
of minimum temperature, especially during summer. This could connect to an
increase in the heat waves (days with Tmax > 90th percentile of Tmax) and number
of tropical nights (Tmin > 20 °C) over Bologna during the period 2021–2050 with
respect to 1961–1990. In fact, the downscaling o the heat wave index for each season
emphasis a possible increase in the future 2021–2050 with respect to 1961–1990
Fig. 1.24 presents the climate scenarios of seasonal heat wave at Bologna, present
1 Forecasting Models for Urban Warming in Climate Change
Ensemble Mean (EM) of climate change projections of: winter(DJF), spring (MAM),
summer (JJA) and autumn (SON) maximum temperature -Bologna
station; Scenario A1B (2021:2050-1961:1990)-output of SDs
EM_djf 2021-2050
Climate_djf 1961-1990
Climate_mam 1961-1990
Climate_jja 1961-1990
Climate_son_1961-1990
EM_mam 2021-2050
EM_jja 2021-2050
EM_son_2021-2050
-8
-7
-6
-5
-4
-3
-2
-1
0
1
2
3
4
5
6
7
∆T(°C)
8
Probability Density Function
0.0
0.1
0.2
0.3
0.4
0.5
0.6
0.7
0.8
Fig. 1.23 Ensemble Mean (EM) of seasonal changes of maximum temperature projected at
Bologna station (CCAReg model), scenario A1B, 2021–2050 with respect to 1961–1990
A similar signal of warming has been projected in seasonal maximum
temperature. As it could be noted from Fig. 1.23, that presents the Ensemble Mean
of changes in seasonal maximum temperature, the projected warming is around
1 °C during winter, similar with those projected in minimum temperature. During
spring and autumn the maximum temperature is projected to increase with 2 °C
(central moment of the distribution) with respect to 1961–1990. The peak of warming is projected to appear during summer season when the changes will be around
2.5 °C (central moment of the distribution).
Analyzing the PDFs of changes in seasonal minimum and maximum temperature (Figs. 1.22 and 1.23) it could be noted that all projected distributions (dashed
curves) tend to shift to warm values with respect to present distributions (continuous
curves). In addition significant changes could be noted not only in the central
moment of the distribution but also in the tails, more significant in the upper tails of
summer minimum and maximum temperatures when the 90th percentile could
reach changes of 5 °C. A signal of increasing could be noted also in 10th percentile
of minimum temperature, especially during summer. This could connect to an
increase in the heat waves (days with Tmax > 90th percentile of Tmax) and number
of tropical nights (Tmin > 20 °C) over Bologna during the period 2021–2050 with
respect to 1961–1990. In fact, the downscaling o the heat wave index for each season
emphasis a possible increase in the future 2021–2050 with respect to 1961–1990
Fig. 1.24 presents the climate scenarios of seasonal heat wave at Bologna, present
1 Forecasting Models for Urban Warming in Climate Change