

32
In summer the strongest effect is shown, with clear extension of high temperature in
evening hours both in city center data and in the simulation with urban effect
included, to some extent as well in case of the second vicinity point, which has
rather suburban character and it seems to be interpreted by the model with similar
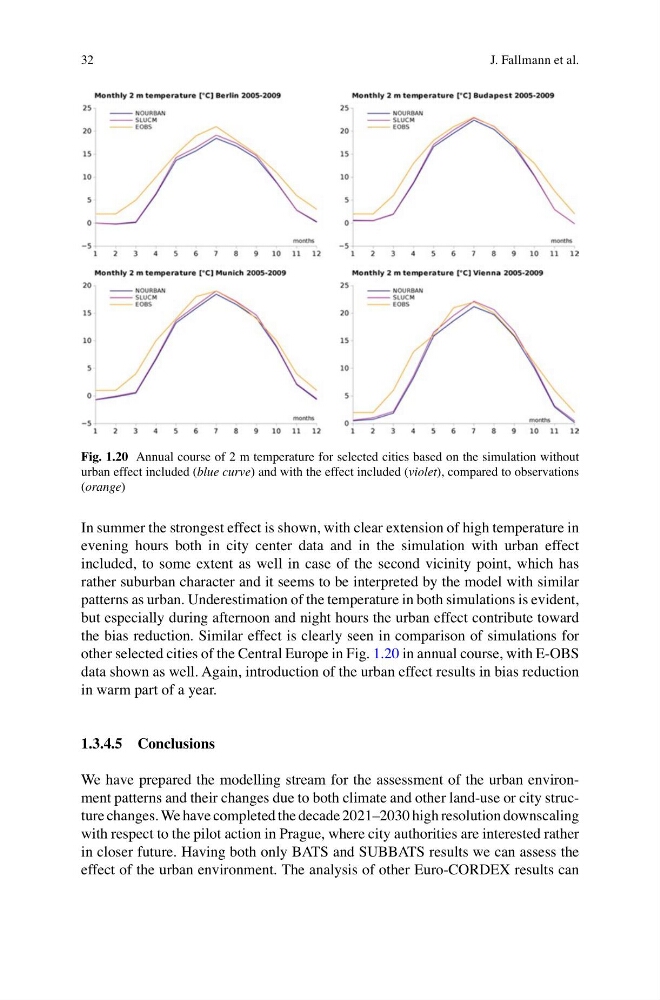
patterns as urban. Underestimation of the temperature in both simulations is evident,
but especially during afternoon and night hours the urban effect contribute toward
the bias reduction. Similar effect is clearly seen in comparison of simulations for
other selected cities of the Central Europe in Fig. 1.20 in annual course, with E-OBS
data shown as well. Again, introduction of the urban effect results in bias reduction
in warm part of a year.
1.3.4.5 Conclusions
We have prepared the modelling stream for the assessment of the urban environment patterns and their changes due to both climate and other land-use or city structure changes. We have completed the decade 2021–2030 high resolution downscaling
with respect to the pilot action in Prague, where city authorities are interested rather
in closer future. Having both only BATS and SUBBATS results we can assess the
effect of the urban environment. The analysis of other Euro-CORDEX results can
Fig. 1.20 Annual course of 2 m temperature for selected cities based on the simulation without
urban effect included (blue curve) and with the effect included (violet), compared to observations
(orange)
J. Fallmann et al.
In summer the strongest effect is shown, with clear extension of high temperature in
evening hours both in city center data and in the simulation with urban effect
included, to some extent as well in case of the second vicinity point, which has
rather suburban character and it seems to be interpreted by the model with similar
patterns as urban. Underestimation of the temperature in both simulations is evident,
but especially during afternoon and night hours the urban effect contribute toward
the bias reduction. Similar effect is clearly seen in comparison of simulations for
other selected cities of the Central Europe in Fig. 1.20 in annual course, with E-OBS
data shown as well. Again, introduction of the urban effect results in bias reduction
in warm part of a year.
1.3.4.5 Conclusions
We have prepared the modelling stream for the assessment of the urban environment patterns and their changes due to both climate and other land-use or city structure changes. We have completed the decade 2021–2030 high resolution downscaling
with respect to the pilot action in Prague, where city authorities are interested rather
in closer future. Having both only BATS and SUBBATS results we can assess the
effect of the urban environment. The analysis of other Euro-CORDEX results can
Fig. 1.20 Annual course of 2 m temperature for selected cities based on the simulation without
urban effect included (blue curve) and with the effect included (violet), compared to observations
(orange)
J. Fallmann et al.