

31
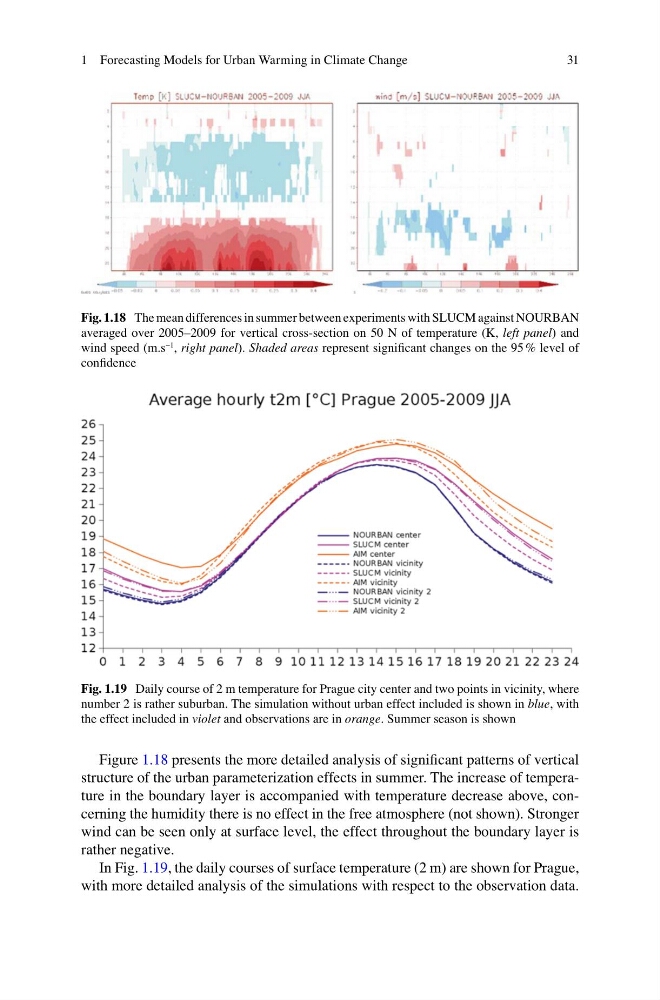
Figure 1.18 presents the more detailed analysis of significant patterns of vertical
structure of the urban parameterization effects in summer. The increase of temperature in the boundary layer is accompanied with temperature decrease above, concerning the humidity there is no effect in the free atmosphere (not shown). Stronger
wind can be seen only at surface level, the effect throughout the boundary layer is
rather negative.
In Fig. 1.19, the daily courses of surface temperature (2 m) are shown for Prague,
with more detailed analysis of the simulations with respect to the observation data.
Fig. 1.18 The mean differences in summer between experiments with SLUCM against NOURBAN
averaged over 2005–2009 for vertical cross-section on 50 N of temperature (K, left panel) and
wind speed (m.s
−1 , right panel). Shaded areas represent significant changes on the 95 % level of
confidence
Fig. 1.19 Daily course of 2 m temperature for Prague city center and two points in vicinity, where
number 2 is rather suburban. The simulation without urban effect included is shown in blue, with
the effect included in violet and observations are in orange. Summer season is shown
1 Forecasting Models for Urban Warming in Climate Change
Figure 1.18 presents the more detailed analysis of significant patterns of vertical
structure of the urban parameterization effects in summer. The increase of temperature in the boundary layer is accompanied with temperature decrease above, concerning the humidity there is no effect in the free atmosphere (not shown). Stronger
wind can be seen only at surface level, the effect throughout the boundary layer is
rather negative.
In Fig. 1.19, the daily courses of surface temperature (2 m) are shown for Prague,
with more detailed analysis of the simulations with respect to the observation data.
Fig. 1.18 The mean differences in summer between experiments with SLUCM against NOURBAN
averaged over 2005–2009 for vertical cross-section on 50 N of temperature (K, left panel) and
wind speed (m.s
−1 , right panel). Shaded areas represent significant changes on the 95 % level of
confidence
Fig. 1.19 Daily course of 2 m temperature for Prague city center and two points in vicinity, where
number 2 is rather suburban. The simulation without urban effect included is shown in blue, with
the effect included in violet and observations are in orange. Summer season is shown
1 Forecasting Models for Urban Warming in Climate Change