

329
12.4 Urban Heat Island Atlas
The Urban heat island atlas is an internet application for visualization of spatial
data, related to urban heat island in the area of Central European countries (Ciglič
and Komac 2015 ). The database was elaborated in GIS environment using ArcGIS
Desktop and published online using ArcGIS Server. This project result is intended
to support decision-makers in the fi eld of spatial planning and is therefore freeaccessible to everyone at http://zalozba.zrc-sazu.si/p/1352 .
The atlas presents urban heat island infl uencing factors including elevation, normalized difference vegetation index, land use (Corine land cover and Urban atlas
data), human activity shown by night scene image (detected by VIIRS sensor data),
air temperature at 2 m and land surface temperatures (Komac and Ciglič 2014 ).
Viewer can analyse the data by making profi les across the temperature layers for
April and August (at 2 p.m.). In this way, temperatures in the city and the surroundings can be compared (see the example of Ljubljana in Fig. 12.7 ).
Various local and regional datasets provided by the project partners are also presented in the atlas.
The atlas was prepared by the Anton Melik geographical institute ZRC SAZU
and Hungarian meteorological service.
12.5 Mitigation of the Urban Heat Island in the Ljubljana
City Area
The purpose of the project was to establish the existence of a heat island, which was
confi rmed by data from meteorological stations and satellite thermography, and
then use this knowledge to mitigate the effects of heat islands.
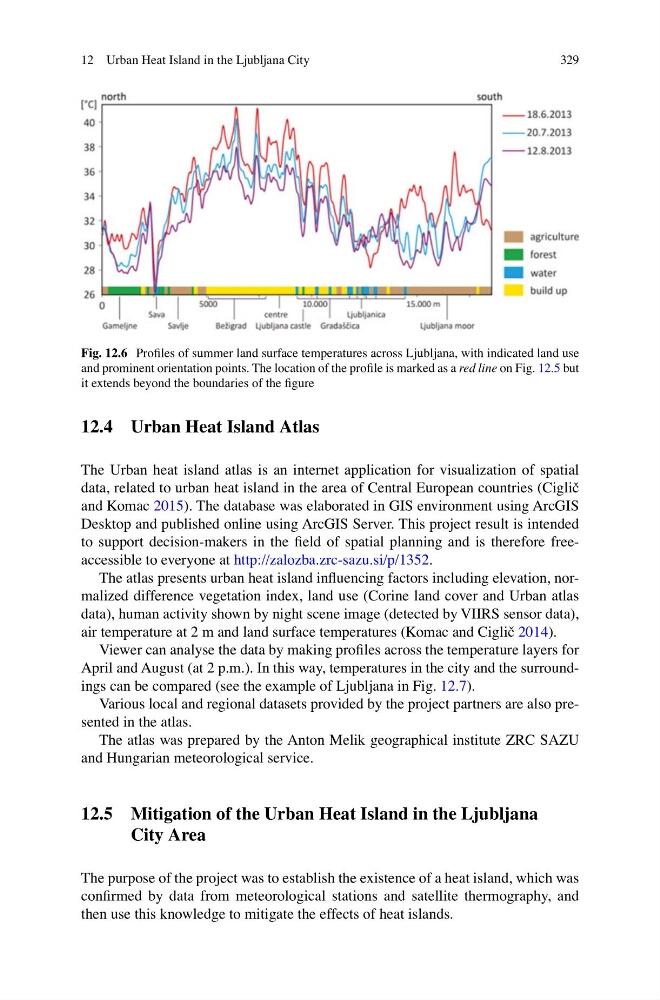
Fig. 12.6 Profi les of summer land surface temperatures across Ljubljana, with indicated land use
and prominent orientation points. The location of the profi le is marked as a red line on Fig. 12.5 but
it extends beyond the boundaries of the fi gure
12 Urban Heat Island in the Ljubljana City
12.4 Urban Heat Island Atlas
The Urban heat island atlas is an internet application for visualization of spatial
data, related to urban heat island in the area of Central European countries (Ciglič
and Komac 2015 ). The database was elaborated in GIS environment using ArcGIS
Desktop and published online using ArcGIS Server. This project result is intended
to support decision-makers in the fi eld of spatial planning and is therefore freeaccessible to everyone at http://zalozba.zrc-sazu.si/p/1352 .
The atlas presents urban heat island infl uencing factors including elevation, normalized difference vegetation index, land use (Corine land cover and Urban atlas
data), human activity shown by night scene image (detected by VIIRS sensor data),
air temperature at 2 m and land surface temperatures (Komac and Ciglič 2014 ).
Viewer can analyse the data by making profi les across the temperature layers for
April and August (at 2 p.m.). In this way, temperatures in the city and the surroundings can be compared (see the example of Ljubljana in Fig. 12.7 ).
Various local and regional datasets provided by the project partners are also presented in the atlas.
The atlas was prepared by the Anton Melik geographical institute ZRC SAZU
and Hungarian meteorological service.
12.5 Mitigation of the Urban Heat Island in the Ljubljana
City Area
The purpose of the project was to establish the existence of a heat island, which was
confi rmed by data from meteorological stations and satellite thermography, and
then use this knowledge to mitigate the effects of heat islands.
Fig. 12.6 Profi les of summer land surface temperatures across Ljubljana, with indicated land use
and prominent orientation points. The location of the profi le is marked as a red line on Fig. 12.5 but
it extends beyond the boundaries of the fi gure
12 Urban Heat Island in the Ljubljana City