

217
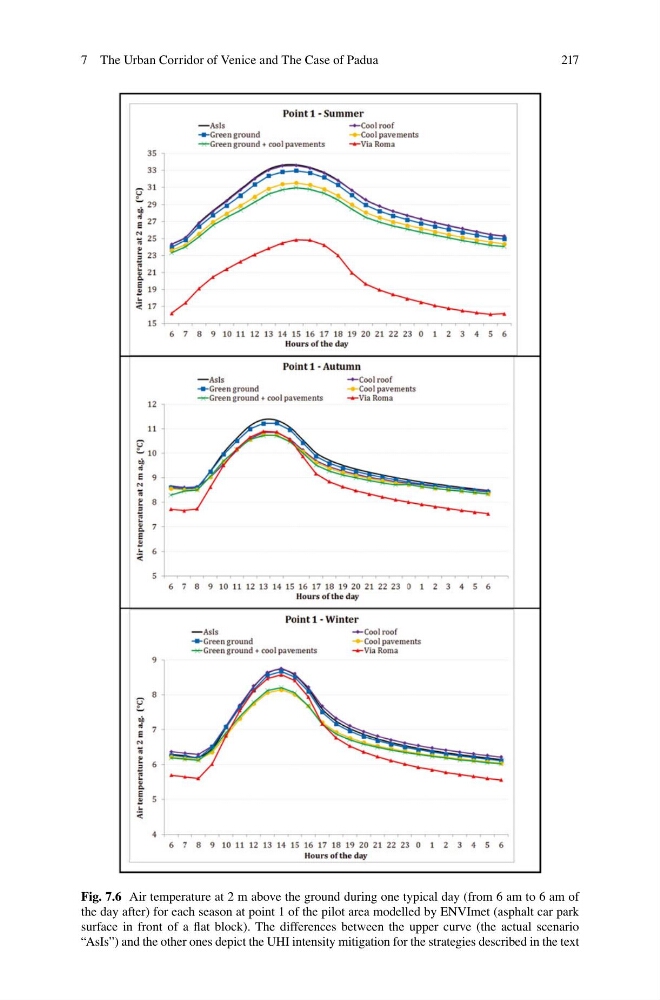
Fig. 7.6 Air temperature at 2 m above the ground during one typical day (from 6 am to 6 am of
the day after) for each season at point 1 of the pilot area modelled by ENVImet (asphalt car park
surface in front of a fl at block). The differences between the upper curve (the actual scenario
“AsIs”) and the other ones depict the UHI intensity mitigation for the strategies described in the text
7 The Urban Corridor of Venice and The Case of Padua
Fig. 7.6 Air temperature at 2 m above the ground during one typical day (from 6 am to 6 am of
the day after) for each season at point 1 of the pilot area modelled by ENVImet (asphalt car park
surface in front of a fl at block). The differences between the upper curve (the actual scenario
“AsIs”) and the other ones depict the UHI intensity mitigation for the strategies described in the text
7 The Urban Corridor of Venice and The Case of Padua