

216
Results, in terms of 24 h of air temperature at 2 m above ground and UHI intensity with respect to Via Roma (rural zone) are reported in Fig. 7.6 for the point 1 of
Fig. 7.4 (as representative of the area) and for the four characteristic days of the
year. Summarizing, the main results were:
– The higher UHI intensity (difference between the “AsIs” and “Via Roma” curves
per each hour of the day) is obviously obtained in summer. During the other
seasons the UHI phenomenon is much lower and negligible in winter during the
central hours of the day;
– Talking about the summer, the higher UHI intensity (9–10 °C) is noticed after the
sunset (8 pm) and till the fi rst sunrise (4 am);
– The same value of 9–10 °C for the UHI intensity during the day is noticed only
for point 2 (1 pm), that is a street canyon (characterized by low SVF and impervious surfaces); for the other points the maximum daily UHI intensity is always
lower than 9 °C;
– The best UHI mitigation strategy is the “Green ground + cool pavements”
(Scenario 4) that allows 2 °C decrease in UHI maximum intensity (but till nearly
3 °C decrease in Point 2);
– The “Cool pavements” mitigation strategy allows between 1 and 2 °C decrease
in UHI maximum intensity in all the points;
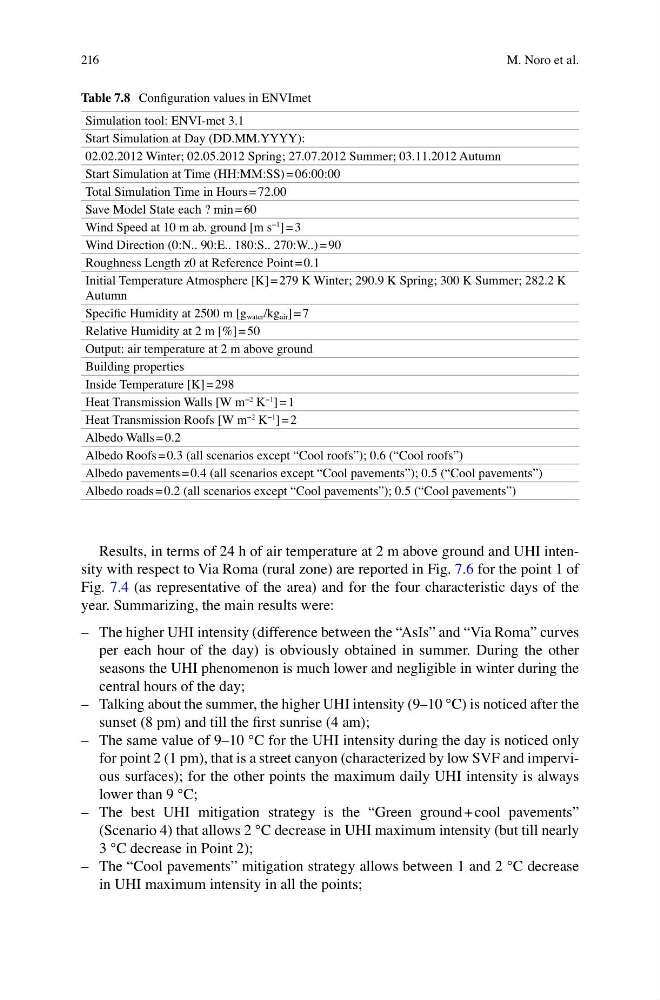
Table 7.8 Confi guration values in ENVImet
Simulation tool: ENVI-met 3.1
Start Simulation at Day (DD.MM.YYYY):
02.02.2012 Winter; 02.05.2012 Spring; 27.07.2012 Summer; 03.11.2012 Autumn
Start Simulation at Time (HH:MM:SS) = 06:00:00
Total Simulation Time in Hours = 72.00
Save Model State each ? min = 60
Wind Speed at 10 m ab. ground [m s
−1
] = 3
Wind Direction (0:N.. 90:E.. 180:S.. 270:W..) = 90
Roughness Length z0 at Reference Point = 0.1
Initial Temperature Atmosphere [K] = 279 K Winter; 290.9 K Spring; 300 K Summer; 282.2 K
Autumn
Specifi c Humidity at 2500 m [g water /kg air ] = 7
Relative Humidity at 2 m [%] = 50
Output: air temperature at 2 m above ground
Building properties
Inside Temperature [K] = 298
Heat Transmission Walls [W m
−2 K
−1 ] = 1
Heat Transmission Roofs [W m
−2 K
−1
] = 2
Albedo Walls = 0.2
Albedo Roofs = 0.3 (all scenarios except “Cool roofs”); 0.6 (“Cool roofs”)
Albedo pavements = 0.4 (all scenarios except “Cool pavements”); 0.5 (“Cool pavements”)
Albedo roads = 0.2 (all scenarios except “Cool pavements”); 0.5 (“Cool pavements”)
M. Noro et al.
Results, in terms of 24 h of air temperature at 2 m above ground and UHI intensity with respect to Via Roma (rural zone) are reported in Fig. 7.6 for the point 1 of
Fig. 7.4 (as representative of the area) and for the four characteristic days of the
year. Summarizing, the main results were:
– The higher UHI intensity (difference between the “AsIs” and “Via Roma” curves
per each hour of the day) is obviously obtained in summer. During the other
seasons the UHI phenomenon is much lower and negligible in winter during the
central hours of the day;
– Talking about the summer, the higher UHI intensity (9–10 °C) is noticed after the
sunset (8 pm) and till the fi rst sunrise (4 am);
– The same value of 9–10 °C for the UHI intensity during the day is noticed only
for point 2 (1 pm), that is a street canyon (characterized by low SVF and impervious surfaces); for the other points the maximum daily UHI intensity is always
lower than 9 °C;
– The best UHI mitigation strategy is the “Green ground + cool pavements”
(Scenario 4) that allows 2 °C decrease in UHI maximum intensity (but till nearly
3 °C decrease in Point 2);
– The “Cool pavements” mitigation strategy allows between 1 and 2 °C decrease
in UHI maximum intensity in all the points;
Table 7.8 Confi guration values in ENVImet
Simulation tool: ENVI-met 3.1
Start Simulation at Day (DD.MM.YYYY):
02.02.2012 Winter; 02.05.2012 Spring; 27.07.2012 Summer; 03.11.2012 Autumn
Start Simulation at Time (HH:MM:SS) = 06:00:00
Total Simulation Time in Hours = 72.00
Save Model State each ? min = 60
Wind Speed at 10 m ab. ground [m s
−1
] = 3
Wind Direction (0:N.. 90:E.. 180:S.. 270:W..) = 90
Roughness Length z0 at Reference Point = 0.1
Initial Temperature Atmosphere [K] = 279 K Winter; 290.9 K Spring; 300 K Summer; 282.2 K
Autumn
Specifi c Humidity at 2500 m [g water /kg air ] = 7
Relative Humidity at 2 m [%] = 50
Output: air temperature at 2 m above ground
Building properties
Inside Temperature [K] = 298
Heat Transmission Walls [W m
−2 K
−1 ] = 1
Heat Transmission Roofs [W m
−2 K
−1
] = 2
Albedo Walls = 0.2
Albedo Roofs = 0.3 (all scenarios except “Cool roofs”); 0.6 (“Cool roofs”)
Albedo pavements = 0.4 (all scenarios except “Cool pavements”); 0.5 (“Cool pavements”)
Albedo roads = 0.2 (all scenarios except “Cool pavements”); 0.5 (“Cool pavements”)
M. Noro et al.