

208
conditions determines, for a person with summer clothing (0.5 clo) and slight level
of activity (metabolic rate 80 W), slight thermal stress (PMV and PET) or thermal
comfort (SET*). During day-time UHI intensity was small, about 0.4–0.8 °C. Lower
values of UHI could be measured during the morning because direct solar radiation
would reach the point of measurement only during central hours of the day
(Table 7.2 ).
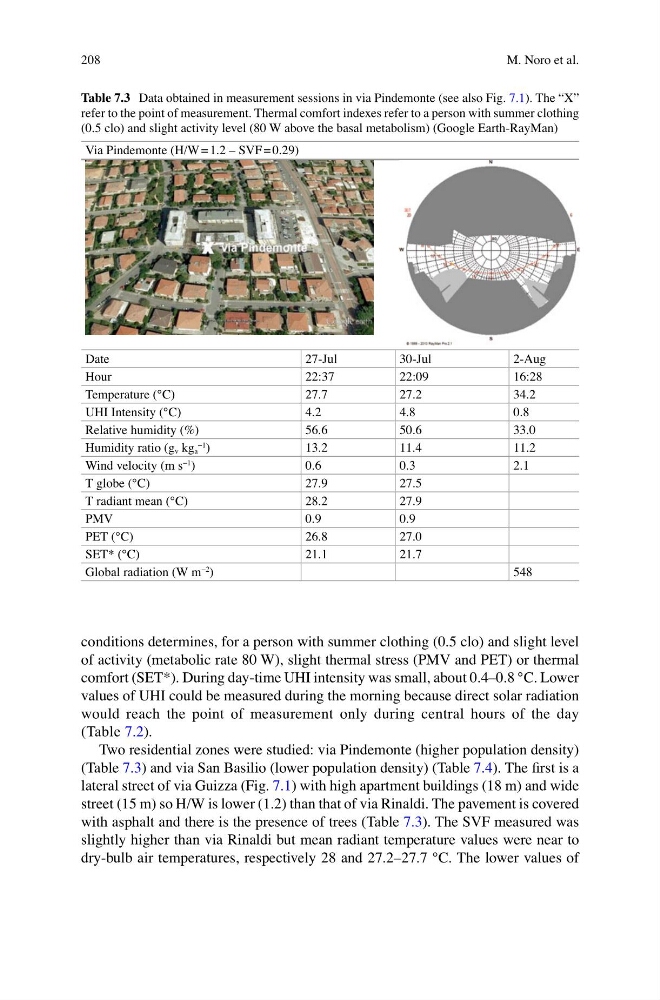
Two residential zones were studied: via Pindemonte (higher population density)
(Table 7.3 ) and via San Basilio (lower population density) (Table 7.4 ). The fi rst is a
lateral street of via Guizza (Fig. 7.1 ) with high apartment buildings (18 m) and wide
street (15 m) so H/W is lower (1.2) than that of via Rinaldi. The pavement is covered
with asphalt and there is the presence of trees (Table 7.3 ). The SVF measured was
slightly higher than via Rinaldi but mean radiant temperature values were near to
dry-bulb air temperatures, respectively 28 and 27.2–27.7 °C. The lower values of
Table 7.3 Data obtained in measurement sessions in via Pindemonte (see also Fig. 7.1 ). The “X”
refer to the point of measurement. Thermal comfort indexes refer to a person with summer clothing
(0.5 clo) and slight activity level (80 W above the basal metabolism) (Google Earth-RayMan)
Via Pindemonte (H/W = 1.2 – SVF = 0.29)
Date
27-Jul
30-Jul
2-Aug
Hour
22:37
22:09
16:28
Temperature (°C)
27.7
27.2
34.2
UHI Intensity (°C)
4.2
4.8
0.8
Relative humidity (%)
56.6
50.6
33.0
Humidity ratio (g v kg a
−1 )
13.2
11.4
11.2
Wind velocity (m s
−1
)
0.6
0.3
2.1
T globe (°C)
27.9
27.5
T radiant mean (°C)
28.2
27.9
PMV
0.9
0.9
PET (°C)
26.8
27.0
SET* (°C)
21.1
21.7
Global radiation (W m
−2
)
548
M. Noro et al.
conditions determines, for a person with summer clothing (0.5 clo) and slight level
of activity (metabolic rate 80 W), slight thermal stress (PMV and PET) or thermal
comfort (SET*). During day-time UHI intensity was small, about 0.4–0.8 °C. Lower
values of UHI could be measured during the morning because direct solar radiation
would reach the point of measurement only during central hours of the day
(Table 7.2 ).
Two residential zones were studied: via Pindemonte (higher population density)
(Table 7.3 ) and via San Basilio (lower population density) (Table 7.4 ). The fi rst is a
lateral street of via Guizza (Fig. 7.1 ) with high apartment buildings (18 m) and wide
street (15 m) so H/W is lower (1.2) than that of via Rinaldi. The pavement is covered
with asphalt and there is the presence of trees (Table 7.3 ). The SVF measured was
slightly higher than via Rinaldi but mean radiant temperature values were near to
dry-bulb air temperatures, respectively 28 and 27.2–27.7 °C. The lower values of
Table 7.3 Data obtained in measurement sessions in via Pindemonte (see also Fig. 7.1 ). The “X”
refer to the point of measurement. Thermal comfort indexes refer to a person with summer clothing
(0.5 clo) and slight activity level (80 W above the basal metabolism) (Google Earth-RayMan)
Via Pindemonte (H/W = 1.2 – SVF = 0.29)
Date
27-Jul
30-Jul
2-Aug
Hour
22:37
22:09
16:28
Temperature (°C)
27.7
27.2
34.2
UHI Intensity (°C)
4.2
4.8
0.8
Relative humidity (%)
56.6
50.6
33.0
Humidity ratio (g v kg a
−1 )
13.2
11.4
11.2
Wind velocity (m s
−1
)
0.6
0.3
2.1
T globe (°C)
27.9
27.5
T radiant mean (°C)
28.2
27.9
PMV
0.9
0.9
PET (°C)
26.8
27.0
SET* (°C)
21.1
21.7
Global radiation (W m
−2
)
548
M. Noro et al.