

206
7.3.2 In Situ Measurements
Besides the mobile surveys, in situ measurements were performed in some characteristic sites of the city area along the path, in order to measure air temperature and
humidity, wind velocity and mean radiant temperature. Consequently these data
were processed using the RayMan model (Matzarakis et al. 2007 , 2010 ) in order to
calculate some outdoor thermal comfort indexes: the Predicted Mean Vote (PMV),
the Physiological Equivalent Temperature (PET) and the new Standard Effective
Temperature (SET*). RayMan model is a simulation tool for the estimation of radiation fl uxes and mean radiant temperature ( T mr ) and other variables, compatible
with Windows® that can analyse complex urban structures and other environments.
The model requires only basic meteorological data (air temperature, air humidity
and wind speed) for the simulation of radiation fl ux densities and common thermal
indices for the thermal human-bioclimate.
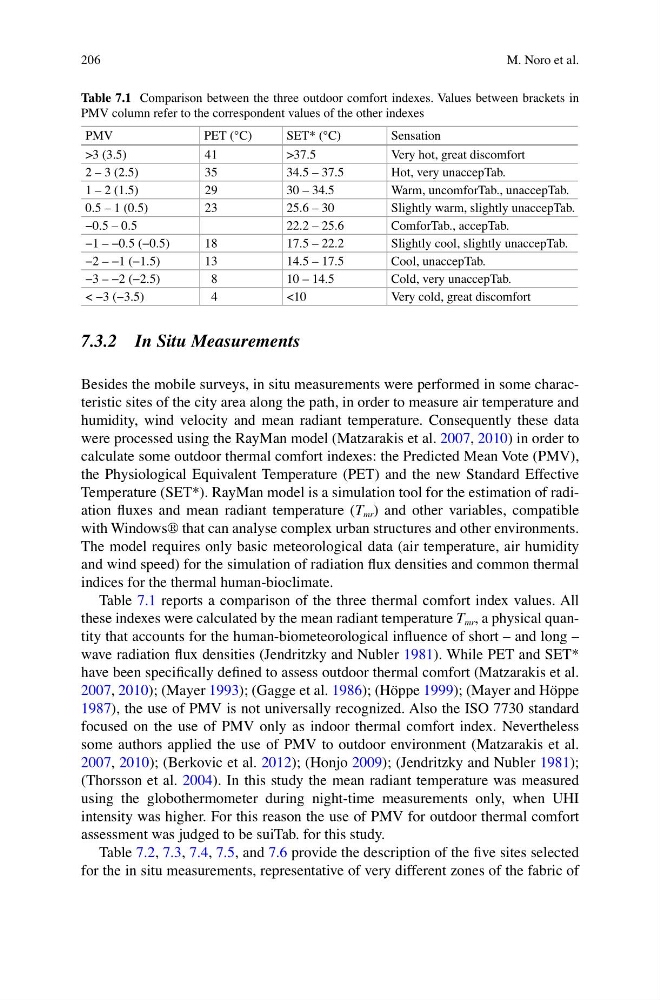
Table 7.1 reports a comparison of the three thermal comfort index values. All
these indexes were calculated by the mean radiant temperature T mr , a physical quantity that accounts for the human-biometeorological infl uence of short – and long –
wave radiation fl ux densities (Jendritzky and Nubler 1981 ). While PET and SET*
have been specifi cally defi ned to assess outdoor thermal comfort (Matzarakis et al.
2007 , 2010 ); (Mayer 1993 ); (Gagge et al. 1986 ); (Höppe 1999 ); (Mayer and Höppe
1987 ), the use of PMV is not universally recognized. Also the ISO 7730 standard
focused on the use of PMV only as indoor thermal comfort index. Nevertheless
some authors applied the use of PMV to outdoor environment (Matzarakis et al.
2007 , 2010 ); (Berkovic et al. 2012 ); (Honjo 2009 ); (Jendritzky and Nubler 1981 );
(Thorsson et al. 2004 ). In this study the mean radiant temperature was measured
using the globothermometer during night-time measurements only, when UHI
intensity was higher. For this reason the use of PMV for outdoor thermal comfort
assessment was judged to be suiTab. for this study.
Table 7.2 , 7.3 , 7.4 , 7.5 , and 7.6 provide the description of the fi ve sites selected
for the in situ measurements, representative of very different zones of the fabric of
Table 7.1 Comparison between the three outdoor comfort indexes. Values between brackets in
PMV column refer to the correspondent values of the other indexes
PMV
PET (°C)
SET* (°C)
Sensation
>3 (3.5)
41
>37.5
Very hot, great discomfort
2 – 3 (2.5)
35
34.5 – 37.5
Hot, very unaccepTab.
1 – 2 (1.5)
29
30 – 34.5
Warm, uncomforTab., unaccepTab.
0.5 – 1 (0.5)
23
25.6 – 30
Slightly warm, slightly unaccepTab.
−0.5 – 0.5
22.2 – 25.6
ComforTab., accepTab.
−1 – −0.5 (−0.5)
18
17.5 – 22.2
Slightly cool, slightly unaccepTab.
−2 – −1 (−1.5)
13
14.5 – 17.5
Cool, unaccepTab.
−3 – −2 (−2.5)
8
10 – 14.5
Cold, very unaccepTab.
< −3 (−3.5)
4
<10
Very cold, great discomfort
M. Noro et al.
7.3.2 In Situ Measurements
Besides the mobile surveys, in situ measurements were performed in some characteristic sites of the city area along the path, in order to measure air temperature and
humidity, wind velocity and mean radiant temperature. Consequently these data
were processed using the RayMan model (Matzarakis et al. 2007 , 2010 ) in order to
calculate some outdoor thermal comfort indexes: the Predicted Mean Vote (PMV),
the Physiological Equivalent Temperature (PET) and the new Standard Effective
Temperature (SET*). RayMan model is a simulation tool for the estimation of radiation fl uxes and mean radiant temperature ( T mr ) and other variables, compatible
with Windows® that can analyse complex urban structures and other environments.
The model requires only basic meteorological data (air temperature, air humidity
and wind speed) for the simulation of radiation fl ux densities and common thermal
indices for the thermal human-bioclimate.
Table 7.1 reports a comparison of the three thermal comfort index values. All
these indexes were calculated by the mean radiant temperature T mr , a physical quantity that accounts for the human-biometeorological infl uence of short – and long –
wave radiation fl ux densities (Jendritzky and Nubler 1981 ). While PET and SET*
have been specifi cally defi ned to assess outdoor thermal comfort (Matzarakis et al.
2007 , 2010 ); (Mayer 1993 ); (Gagge et al. 1986 ); (Höppe 1999 ); (Mayer and Höppe
1987 ), the use of PMV is not universally recognized. Also the ISO 7730 standard
focused on the use of PMV only as indoor thermal comfort index. Nevertheless
some authors applied the use of PMV to outdoor environment (Matzarakis et al.
2007 , 2010 ); (Berkovic et al. 2012 ); (Honjo 2009 ); (Jendritzky and Nubler 1981 );
(Thorsson et al. 2004 ). In this study the mean radiant temperature was measured
using the globothermometer during night-time measurements only, when UHI
intensity was higher. For this reason the use of PMV for outdoor thermal comfort
assessment was judged to be suiTab. for this study.
Table 7.2 , 7.3 , 7.4 , 7.5 , and 7.6 provide the description of the fi ve sites selected
for the in situ measurements, representative of very different zones of the fabric of
Table 7.1 Comparison between the three outdoor comfort indexes. Values between brackets in
PMV column refer to the correspondent values of the other indexes
PMV
PET (°C)
SET* (°C)
Sensation
>3 (3.5)
41
>37.5
Very hot, great discomfort
2 – 3 (2.5)
35
34.5 – 37.5
Hot, very unaccepTab.
1 – 2 (1.5)
29
30 – 34.5
Warm, uncomforTab., unaccepTab.
0.5 – 1 (0.5)
23
25.6 – 30
Slightly warm, slightly unaccepTab.
−0.5 – 0.5
22.2 – 25.6
ComforTab., accepTab.
−1 – −0.5 (−0.5)
18
17.5 – 22.2
Slightly cool, slightly unaccepTab.
−2 – −1 (−1.5)
13
14.5 – 17.5
Cool, unaccepTab.
−3 – −2 (−2.5)
8
10 – 14.5
Cold, very unaccepTab.
< −3 (−3.5)
4
<10
Very cold, great discomfort
M. Noro et al.