

205
recorded across the narrow streets (high H/W ratio) of the historic centre. As depicted
in Fig. 7.2 , going along via Guizza (a long road that traverse the sub-urban to
inside of the city) UHI intensity would always increase, mainly due to the increase
of the H/W ratio and the increase of the vertical and horizontal impervious surfaces facing the road. The subsequent stretch of path (via Goito) was along San
Gregorio Canal, so the evaporative cooling effect of water would lead to a decrease
of the temperature.
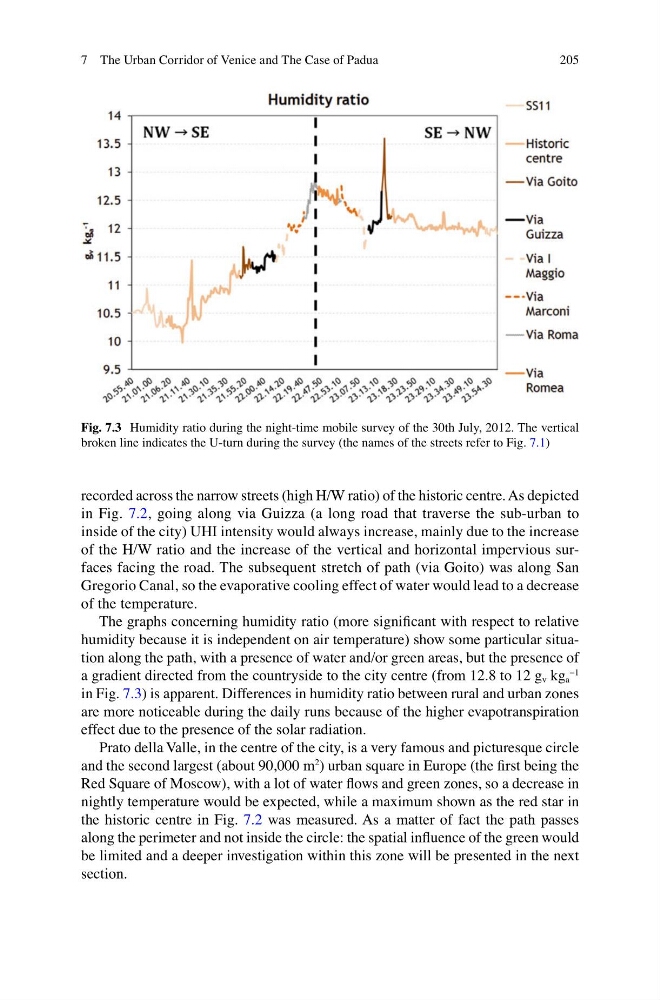
The graphs concerning humidity ratio (more signifi cant with respect to relative
humidity because it is independent on air temperature) show some particular situation along the path, with a presence of water and/or green areas, but the presence of
a gradient directed from the countryside to the city centre (from 12.8 to 12 g v kg a
−1
in Fig. 7.3 ) is apparent. Differences in humidity ratio between rural and urban zones
are more noticeable during the daily runs because of the higher evapotranspiration
effect due to the presence of the solar radiation.
Prato della Valle, in the centre of the city, is a very famous and picturesque circle
and the second largest (about 90,000 m
2 ) urban square in Europe (the fi rst being the
Red Square of Moscow), with a lot of water fl ows and green zones, so a decrease in
nightly temperature would be expected, while a maximum shown as the red star in
the historic centre in Fig. 7.2 was measured. As a matter of fact the path passes
along the perimeter and not inside the circle: the spatial infl uence of the green would
be limited and a deeper investigation within this zone will be presented in the next
section.
Fig. 7.3 Humidity ratio during the night-time mobile survey of the 30th July, 2012. The vertical
broken line indicates the U-turn during the survey (the names of the streets refer to Fig. 7.1 )
7 The Urban Corridor of Venice and The Case of Padua
recorded across the narrow streets (high H/W ratio) of the historic centre. As depicted
in Fig. 7.2 , going along via Guizza (a long road that traverse the sub-urban to
inside of the city) UHI intensity would always increase, mainly due to the increase
of the H/W ratio and the increase of the vertical and horizontal impervious surfaces facing the road. The subsequent stretch of path (via Goito) was along San
Gregorio Canal, so the evaporative cooling effect of water would lead to a decrease
of the temperature.
The graphs concerning humidity ratio (more signifi cant with respect to relative
humidity because it is independent on air temperature) show some particular situation along the path, with a presence of water and/or green areas, but the presence of
a gradient directed from the countryside to the city centre (from 12.8 to 12 g v kg a
−1
in Fig. 7.3 ) is apparent. Differences in humidity ratio between rural and urban zones
are more noticeable during the daily runs because of the higher evapotranspiration
effect due to the presence of the solar radiation.
Prato della Valle, in the centre of the city, is a very famous and picturesque circle
and the second largest (about 90,000 m
2 ) urban square in Europe (the fi rst being the
Red Square of Moscow), with a lot of water fl ows and green zones, so a decrease in
nightly temperature would be expected, while a maximum shown as the red star in
the historic centre in Fig. 7.2 was measured. As a matter of fact the path passes
along the perimeter and not inside the circle: the spatial infl uence of the green would
be limited and a deeper investigation within this zone will be presented in the next
section.
Fig. 7.3 Humidity ratio during the night-time mobile survey of the 30th July, 2012. The vertical
broken line indicates the U-turn during the survey (the names of the streets refer to Fig. 7.1 )
7 The Urban Corridor of Venice and The Case of Padua