

204
Experimental data were logged by mobile surveys from 26 July 2012 to 9 August
2012, some of them in double sessions: day-time (during late afternoon) and
night- time session (between 1 and 4 h after the sunset in order to investigate the
phenomenon during its potentially maximum intensity). Dry-bulb air temperature,
relative humidity and solar global radiation on the horizontal, with a time step of
5 s, were the main variables measured by the mobile station equipped on a vehicle.
UHI intensity was determined by the difference between mobile measured air temperature and the value recorded at the same time by the reference ARPAV (Regional
Agency for Environment Protection in Veneto) rural fi xed meteorological station of
Legnaro (rural zone, 8.5 km far from the city centre).
Details about the path, the instrumentation used and the measurement procedure are available in references (Noro et al. 2015 ). Here some very brief results
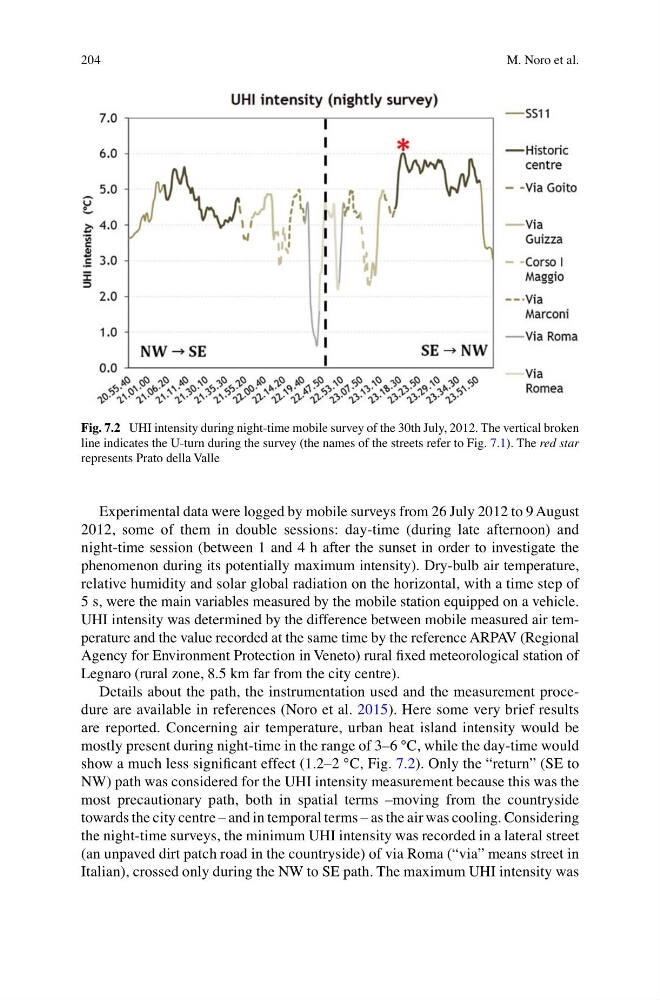
are reported. Concerning air temperature, urban heat island intensity would be
mostly present during night-time in the range of 3–6 °C, while the day-time would
show a much less signifi cant effect (1.2–2 °C, Fig. 7.2 ). Only the “return” (SE to
NW) path was considered for the UHI intensity measurement because this was the
most precautionary path, both in spatial terms –moving from the countryside
towards the city centre – and in temporal terms – as the air was cooling. Considering
the night- time surveys, the minimum UHI intensity was recorded in a lateral street
(an unpaved dirt patch road in the countryside) of via Roma (“via” means street in
Italian), crossed only during the NW to SE path. The maximum UHI intensity was
Fig. 7.2 UHI intensity during night-time mobile survey of the 30th July, 2012. The vertical broken
line indicates the U-turn during the survey (the names of the streets refer to Fig. 7.1 ). The red star
represents Prato della Valle
M. Noro et al.
Experimental data were logged by mobile surveys from 26 July 2012 to 9 August
2012, some of them in double sessions: day-time (during late afternoon) and
night- time session (between 1 and 4 h after the sunset in order to investigate the
phenomenon during its potentially maximum intensity). Dry-bulb air temperature,
relative humidity and solar global radiation on the horizontal, with a time step of
5 s, were the main variables measured by the mobile station equipped on a vehicle.
UHI intensity was determined by the difference between mobile measured air temperature and the value recorded at the same time by the reference ARPAV (Regional
Agency for Environment Protection in Veneto) rural fi xed meteorological station of
Legnaro (rural zone, 8.5 km far from the city centre).
Details about the path, the instrumentation used and the measurement procedure are available in references (Noro et al. 2015 ). Here some very brief results
are reported. Concerning air temperature, urban heat island intensity would be
mostly present during night-time in the range of 3–6 °C, while the day-time would
show a much less signifi cant effect (1.2–2 °C, Fig. 7.2 ). Only the “return” (SE to
NW) path was considered for the UHI intensity measurement because this was the
most precautionary path, both in spatial terms –moving from the countryside
towards the city centre – and in temporal terms – as the air was cooling. Considering
the night- time surveys, the minimum UHI intensity was recorded in a lateral street
(an unpaved dirt patch road in the countryside) of via Roma (“via” means street in
Italian), crossed only during the NW to SE path. The maximum UHI intensity was
Fig. 7.2 UHI intensity during night-time mobile survey of the 30th July, 2012. The vertical broken
line indicates the U-turn during the survey (the names of the streets refer to Fig. 7.1 ). The red star
represents Prato della Valle
M. Noro et al.