

88
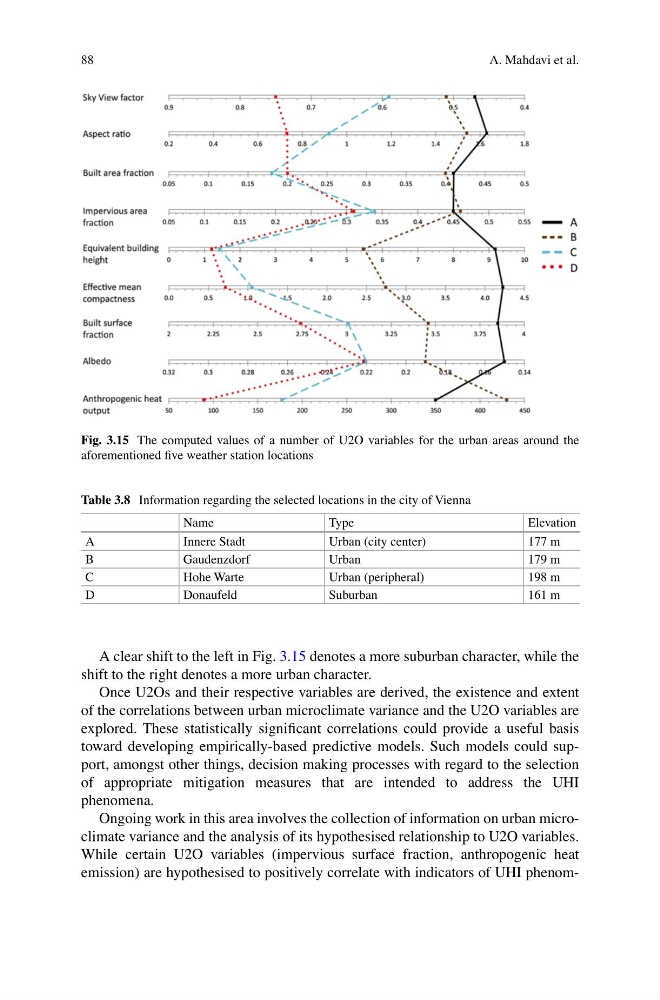
A clear shift to the left in Fig. 3.15 denotes a more suburban character, while the
shift to the right denotes a more urban character.
Once U2Os and their respective variables are derived, the existence and extent
of the correlations between urban microclimate variance and the U2O variables are
explored. These statistically significant correlations could provide a useful basis
toward developing empirically-based predictive models. Such models could support, amongst other things, decision making processes with regard to the selection
of appropriate mitigation measures that are intended to address the UHI
phenomena.
Ongoing work in this area involves the collection of information on urban microclimate variance and the analysis of its hypothesised relationship to U2O variables.
While certain U2O variables (impervious surface fraction, anthropogenic heat
emission) are hypothesised to positively correlate with indicators of UHI phenomFig. 3.15 The computed values of a number of U2O variables for the urban areas around the
aforementioned five weather station locations
Table 3.8 Information regarding the selected locations in the city of Vienna
Name
Type
Elevation
A
Innere Stadt
Urban (city center)
177 m
B
Gaudenzdorf
Urban
179 m
C
Hohe Warte
Urban (peripheral)
198 m
D
Donaufeld
Suburban
161 m
A. Mahdavi et al.
A clear shift to the left in Fig. 3.15 denotes a more suburban character, while the
shift to the right denotes a more urban character.
Once U2Os and their respective variables are derived, the existence and extent
of the correlations between urban microclimate variance and the U2O variables are
explored. These statistically significant correlations could provide a useful basis
toward developing empirically-based predictive models. Such models could support, amongst other things, decision making processes with regard to the selection
of appropriate mitigation measures that are intended to address the UHI
phenomena.
Ongoing work in this area involves the collection of information on urban microclimate variance and the analysis of its hypothesised relationship to U2O variables.
While certain U2O variables (impervious surface fraction, anthropogenic heat
emission) are hypothesised to positively correlate with indicators of UHI phenomFig. 3.15 The computed values of a number of U2O variables for the urban areas around the
aforementioned five weather station locations
Table 3.8 Information regarding the selected locations in the city of Vienna
Name
Type
Elevation
A
Innere Stadt
Urban (city center)
177 m
B
Gaudenzdorf
Urban
179 m
C
Hohe Warte
Urban (peripheral)
198 m
D
Donaufeld
Suburban
161 m
A. Mahdavi et al.