

87
In this framework, the notion of U2O is applied to systematically address the
local variation of the urban climate throughout a city. A spatial dimension (diameter) of approximately 400–1000 m has been targeted for U2O.
As the urban microclimate is believed to be influenced by different urban
morphologies, structures, and material properties, a set of related variables were
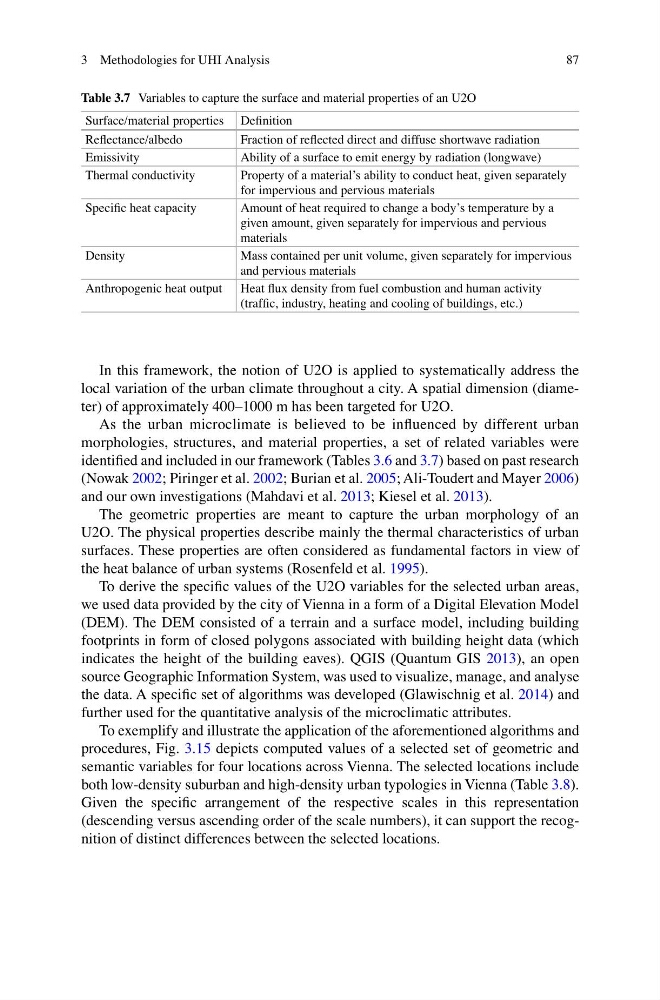
identified and included in our framework (Tables 3.6 and 3.7) based on past research
(Nowak 2002; Piringer et al. 2002; Burian et al. 2005; Ali-Toudert and Mayer 2006)
and our own investigations (Mahdavi et al. 2013; Kiesel et al. 2013).
The geometric properties are meant to capture the urban morphology of an
U2O. The physical properties describe mainly the thermal characteristics of urban
surfaces. These properties are often considered as fundamental factors in view of
the heat balance of urban systems (Rosenfeld et al. 1995).
To derive the specific values of the U2O variables for the selected urban areas,
we used data provided by the city of Vienna in a form of a Digital Elevation Model
(DEM). The DEM consisted of a terrain and a surface model, including building
footprints in form of closed polygons associated with building height data (which
indicates the height of the building eaves). QGIS (Quantum GIS 2013), an open
source Geographic Information System, was used to visualize, manage, and analyse
the data. A specific set of algorithms was developed (Glawischnig et al. 2014) and
further used for the quantitative analysis of the microclimatic attributes.
To exemplify and illustrate the application of the aforementioned algorithms and
procedures, Fig. 3.15 depicts computed values of a selected set of geometric and
semantic variables for four locations across Vienna. The selected locations include
both low-density suburban and high-density urban typologies in Vienna (Table 3.8).
Given the specific arrangement of the respective scales in this representation
(descending versus ascending order of the scale numbers), it can support the recognition of distinct differences between the selected locations.
Table 3.7 Variables to capture the surface and material properties of an U2O
Surface/material properties Definition
Reflectance/albedo
Fraction of reflected direct and diffuse shortwave radiation
Emissivity
Ability of a surface to emit energy by radiation (longwave)
Thermal conductivity
Property of a material’s ability to conduct heat, given separately
for impervious and pervious materials
Specific heat capacity
Amount of heat required to change a body’s temperature by a
given amount, given separately for impervious and pervious
materials
Density
Mass contained per unit volume, given separately for impervious
and pervious materials
Anthropogenic heat output Heat flux density from fuel combustion and human activity
(traffic, industry, heating and cooling of buildings, etc.)
3 Methodologies for UHI Analysis
In this framework, the notion of U2O is applied to systematically address the
local variation of the urban climate throughout a city. A spatial dimension (diameter) of approximately 400–1000 m has been targeted for U2O.
As the urban microclimate is believed to be influenced by different urban
morphologies, structures, and material properties, a set of related variables were
identified and included in our framework (Tables 3.6 and 3.7) based on past research
(Nowak 2002; Piringer et al. 2002; Burian et al. 2005; Ali-Toudert and Mayer 2006)
and our own investigations (Mahdavi et al. 2013; Kiesel et al. 2013).
The geometric properties are meant to capture the urban morphology of an
U2O. The physical properties describe mainly the thermal characteristics of urban
surfaces. These properties are often considered as fundamental factors in view of
the heat balance of urban systems (Rosenfeld et al. 1995).
To derive the specific values of the U2O variables for the selected urban areas,
we used data provided by the city of Vienna in a form of a Digital Elevation Model
(DEM). The DEM consisted of a terrain and a surface model, including building
footprints in form of closed polygons associated with building height data (which
indicates the height of the building eaves). QGIS (Quantum GIS 2013), an open
source Geographic Information System, was used to visualize, manage, and analyse
the data. A specific set of algorithms was developed (Glawischnig et al. 2014) and
further used for the quantitative analysis of the microclimatic attributes.
To exemplify and illustrate the application of the aforementioned algorithms and
procedures, Fig. 3.15 depicts computed values of a selected set of geometric and
semantic variables for four locations across Vienna. The selected locations include
both low-density suburban and high-density urban typologies in Vienna (Table 3.8).
Given the specific arrangement of the respective scales in this representation
(descending versus ascending order of the scale numbers), it can support the recognition of distinct differences between the selected locations.
Table 3.7 Variables to capture the surface and material properties of an U2O
Surface/material properties Definition
Reflectance/albedo
Fraction of reflected direct and diffuse shortwave radiation
Emissivity
Ability of a surface to emit energy by radiation (longwave)
Thermal conductivity
Property of a material’s ability to conduct heat, given separately
for impervious and pervious materials
Specific heat capacity
Amount of heat required to change a body’s temperature by a
given amount, given separately for impervious and pervious
materials
Density
Mass contained per unit volume, given separately for impervious
and pervious materials
Anthropogenic heat output Heat flux density from fuel combustion and human activity
(traffic, industry, heating and cooling of buildings, etc.)
3 Methodologies for UHI Analysis