

84
CTI
i
B i
S i
B i
S i
=
-
(
)
<
å =1
24 q
q
q
q
,
,
,
,
forallintervalswhen
(3.1)
CTD
i
B i
S i
B i
S i
=
-
(
)
>
å =1
24 q
q
q
q
,
,
,
,
forallintervalswhen
(3.2)
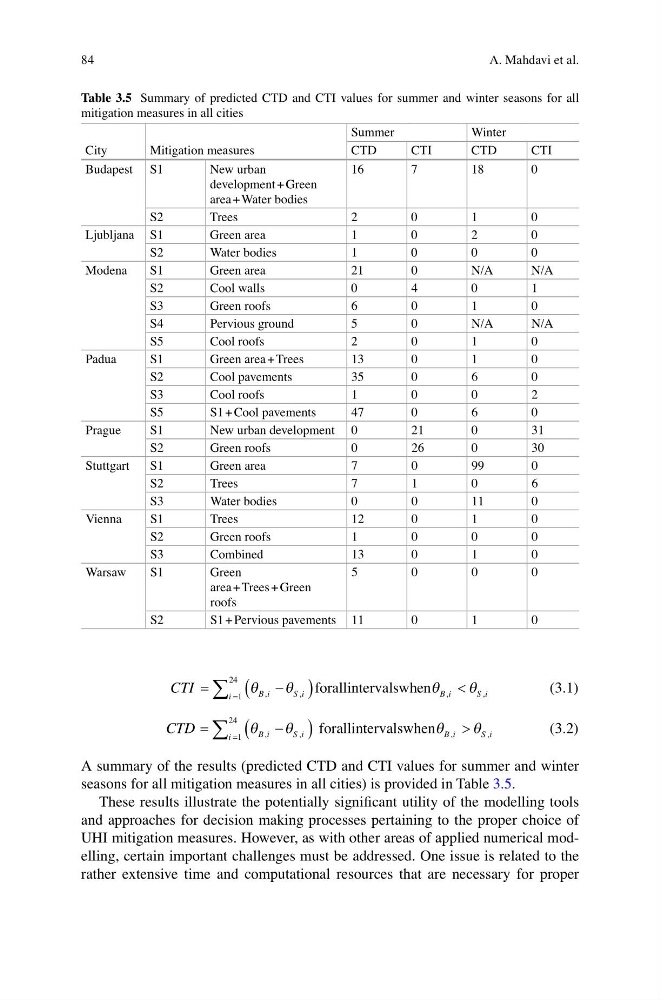
A summary of the results (predicted CTD and CTI values for summer and winter
seasons for all mitigation measures in all cities) is provided in Table 3.5.
These results illustrate the potentially significant utility of the modelling tools
and approaches for decision making processes pertaining to the proper choice of
UHI mitigation measures. However, as with other areas of applied numerical modelling, certain important challenges must be addressed. One issue is related to the
rather extensive time and computational resources that are necessary for proper
Table 3.5 Summary of predicted CTD and CTI values for summer and winter seasons for all
mitigation measures in all cities
City
Mitigation measures
Summer
Winter
CTD
CTI
CTD
CTI
Budapest S1
New urban
development + Green
area + Water bodies
16
7
18
0
S2
Trees
2
0
1
0
Ljubljana S1
Green area
1
0
2
0
S2
Water bodies
1
0
0
0
Modena
S1
Green area
21
0
N/A
N/A
S2
Cool walls
0
4
0
1
S3
Green roofs
6
0
1
0
S4
Pervious ground
5
0
N/A
N/A
S5
Cool roofs
2
0
1
0
Padua
S1
Green area + Trees
13
0
1
0
S2
Cool pavements
35
0
6
0
S3
Cool roofs
1
0
0
2
S5
S1 + Cool pavements
47
0
6
0
Prague
S1
New urban development 0
21
0
31
S2
Green roofs
0
26
0
30
Stuttgart
S1
Green area
7
0
99
0
S2
Trees
7
1
0
6
S3
Water bodies
0
0
11
0
Vienna
S1
Trees
12
0
1
0
S2
Green roofs
1
0
0
0
S3
Combined
13
0
1
0
Warsaw
S1
Green
area + Trees + Green
roofs
5
0
0
0
S2
S1 + Pervious pavements 11
0
1
0
A. Mahdavi et al.
CTI
i
B i
S i
B i
S i
=
-
(
)
<
å =1
24 q
q
q
q
,
,
,
,
forallintervalswhen
(3.1)
CTD
i
B i
S i
B i
S i
=
-
(
)
>
å =1
24 q
q
q
q
,
,
,
,
forallintervalswhen
(3.2)
A summary of the results (predicted CTD and CTI values for summer and winter
seasons for all mitigation measures in all cities) is provided in Table 3.5.
These results illustrate the potentially significant utility of the modelling tools
and approaches for decision making processes pertaining to the proper choice of
UHI mitigation measures. However, as with other areas of applied numerical modelling, certain important challenges must be addressed. One issue is related to the
rather extensive time and computational resources that are necessary for proper
Table 3.5 Summary of predicted CTD and CTI values for summer and winter seasons for all
mitigation measures in all cities
City
Mitigation measures
Summer
Winter
CTD
CTI
CTD
CTI
Budapest S1
New urban
development + Green
area + Water bodies
16
7
18
0
S2
Trees
2
0
1
0
Ljubljana S1
Green area
1
0
2
0
S2
Water bodies
1
0
0
0
Modena
S1
Green area
21
0
N/A
N/A
S2
Cool walls
0
4
0
1
S3
Green roofs
6
0
1
0
S4
Pervious ground
5
0
N/A
N/A
S5
Cool roofs
2
0
1
0
Padua
S1
Green area + Trees
13
0
1
0
S2
Cool pavements
35
0
6
0
S3
Cool roofs
1
0
0
2
S5
S1 + Cool pavements
47
0
6
0
Prague
S1
New urban development 0
21
0
31
S2
Green roofs
0
26
0
30
Stuttgart
S1
Green area
7
0
99
0
S2
Trees
7
1
0
6
S3
Water bodies
0
0
11
0
Vienna
S1
Trees
12
0
1
0
S2
Green roofs
1
0
0
0
S3
Combined
13
0
1
0
Warsaw
S1
Green
area + Trees + Green
roofs
5
0
0
0
S2
S1 + Pervious pavements 11
0
1
0
A. Mahdavi et al.