

NaOH treatment of powdered Mn nodule and disappeared after hydroxylamine
hydrochloride treatment (HAHC) at 25
C, suggests birnesite. The intensity of
diffraction peaks at 0.947 and 0.472 nm increased with the HAHC treatment at
25
C and disappeared with the HAHC treatment at 60
C, suggesting lithiophorite.
The intensity of diffraction peaks at 0.418, 0.268, 0.258, and 0.245 nm, which
disappeared with dithionite–citrate–bicarbonate (DCB), suggests goethite. The diffraction peaks that remained after the DCB treatment, 1.00, 0.501, and 0.334 nm,
correspond to those of a micaceous mineral. All of these results are close to those
reported by Tokashiki et al. (2003).
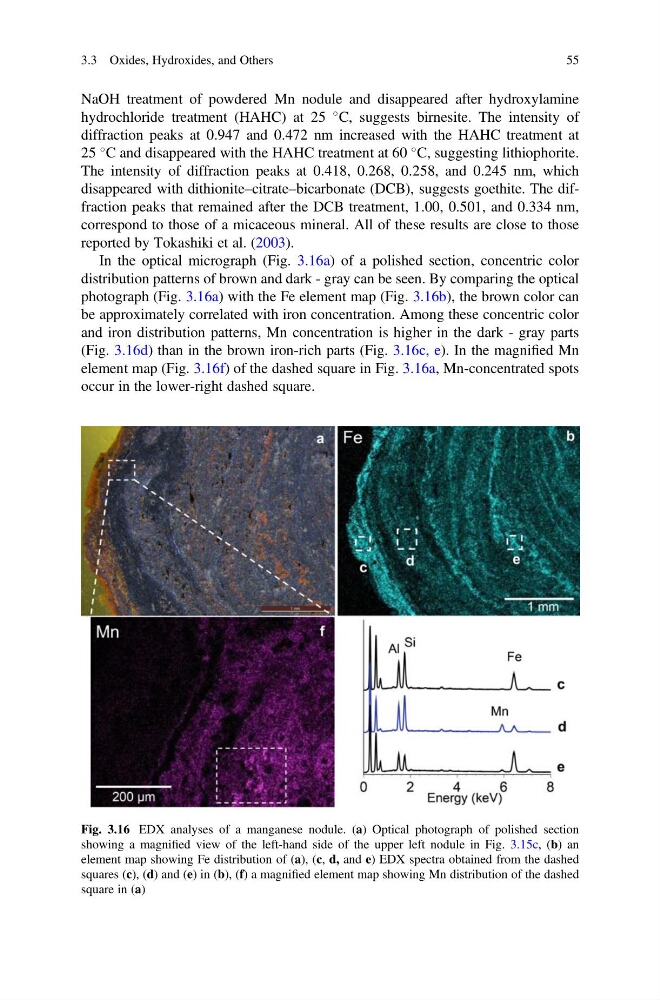
In the optical micrograph (Fig. 3.16a) of a polished section, concentric color
distribution patterns of brown and dark - gray can be seen. By comparing the optical
photograph (Fig. 3.16a) with the Fe element map (Fig. 3.16b), the brown color can
be approximately correlated with iron concentration. Among these concentric color
and iron distribution patterns, Mn concentration is higher in the dark - gray parts
(Fig. 3.16d) than in the brown iron-rich parts (Fig. 3.16c, e). In the magnified Mn
element map (Fig. 3.16f) of the dashed square in Fig. 3.16a, Mn-concentrated spots
occur in the lower-right dashed square.
Fig. 3.16 EDX analyses of a manganese nodule. (a) Optical photograph of polished section
showing a magnified view of the left-hand side of the upper left nodule in Fig. 3.15c, (b) an
element map showing Fe distribution of (a), (c, d, and e) EDX spectra obtained from the dashed
squares (c), (d) and (e) in (b), (f) a magnified element map showing Mn distribution of the dashed
square in (a)
3.3 Oxides, Hydroxides, and Others
55
hydrochloride treatment (HAHC) at 25
C, suggests birnesite. The intensity of
diffraction peaks at 0.947 and 0.472 nm increased with the HAHC treatment at
25
C and disappeared with the HAHC treatment at 60
C, suggesting lithiophorite.
The intensity of diffraction peaks at 0.418, 0.268, 0.258, and 0.245 nm, which
disappeared with dithionite–citrate–bicarbonate (DCB), suggests goethite. The diffraction peaks that remained after the DCB treatment, 1.00, 0.501, and 0.334 nm,
correspond to those of a micaceous mineral. All of these results are close to those
reported by Tokashiki et al. (2003).
In the optical micrograph (Fig. 3.16a) of a polished section, concentric color
distribution patterns of brown and dark - gray can be seen. By comparing the optical
photograph (Fig. 3.16a) with the Fe element map (Fig. 3.16b), the brown color can
be approximately correlated with iron concentration. Among these concentric color
and iron distribution patterns, Mn concentration is higher in the dark - gray parts
(Fig. 3.16d) than in the brown iron-rich parts (Fig. 3.16c, e). In the magnified Mn
element map (Fig. 3.16f) of the dashed square in Fig. 3.16a, Mn-concentrated spots
occur in the lower-right dashed square.
Fig. 3.16 EDX analyses of a manganese nodule. (a) Optical photograph of polished section
showing a magnified view of the left-hand side of the upper left nodule in Fig. 3.15c, (b) an
element map showing Fe distribution of (a), (c, d, and e) EDX spectra obtained from the dashed
squares (c), (d) and (e) in (b), (f) a magnified element map showing Mn distribution of the dashed
square in (a)
3.3 Oxides, Hydroxides, and Others
55