

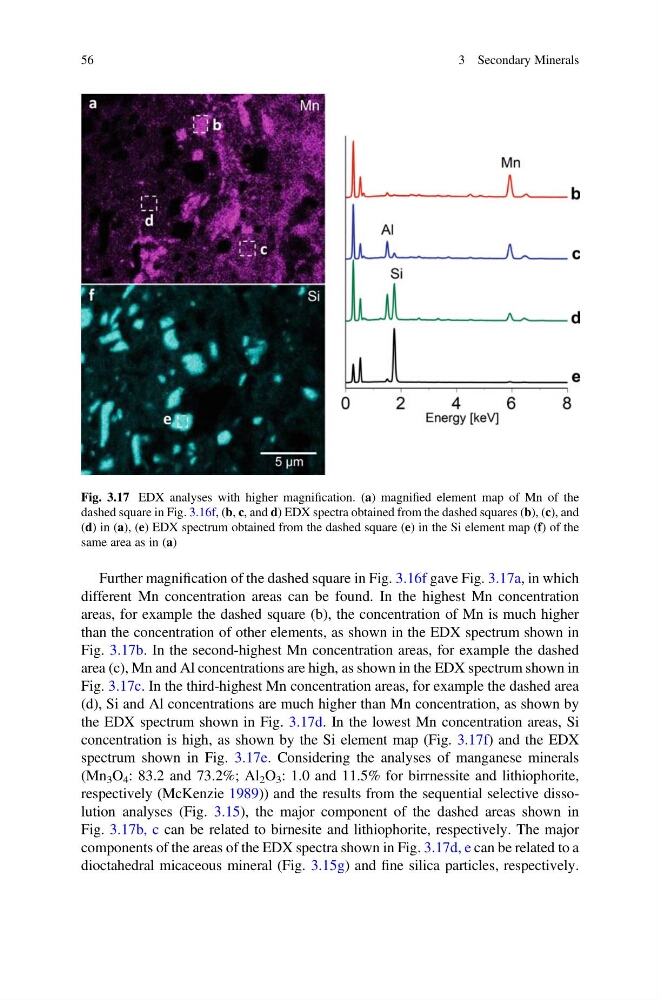
Further magnification of the dashed square in Fig. 3.16f gave Fig. 3.17a, in which
different Mn concentration areas can be found. In the highest Mn concentration
areas, for example the dashed square (b), the concentration of Mn is much higher
than the concentration of other elements, as shown in the EDX spectrum shown in
Fig. 3.17b. In the second-highest Mn concentration areas, for example the dashed
area (c), Mn and Al concentrations are high, as shown in the EDX spectrum shown in
Fig. 3.17c. In the third-highest Mn concentration areas, for example the dashed area
(d), Si and Al concentrations are much higher than Mn concentration, as shown by
the EDX spectrum shown in Fig. 3.17d. In the lowest Mn concentration areas, Si
concentration is high, as shown by the Si element map (Fig. 3.17f) and the EDX
spectrum shown in Fig. 3.17e. Considering the analyses of manganese minerals
(Mn 3 O 4 : 83.2 and 73.2%; Al 2 O 3 : 1.0 and 11.5% for birrnessite and lithiophorite,
respectively (McKenzie 1989)) and the results from the sequential selective dissolution analyses (Fig. 3.15), the major component of the dashed areas shown in
Fig. 3.17b, c can be related to birnesite and lithiophorite, respectively. The major
components of the areas of the EDX spectra shown in Fig. 3.17d, e can be related to a
dioctahedral micaceous mineral (Fig. 3.15g) and fine silica particles, respectively.
Fig. 3.17 EDX analyses with higher magnification. (a) magnified element map of Mn of the
dashed square in Fig. 3.16f, (b, c, and d) EDX spectra obtained from the dashed squares (b), (c), and
(d) in (a), (e) EDX spectrum obtained from the dashed square (e) in the Si element map (f) of the
same area as in (a)
56
3 Secondary Minerals
different Mn concentration areas can be found. In the highest Mn concentration
areas, for example the dashed square (b), the concentration of Mn is much higher
than the concentration of other elements, as shown in the EDX spectrum shown in
Fig. 3.17b. In the second-highest Mn concentration areas, for example the dashed
area (c), Mn and Al concentrations are high, as shown in the EDX spectrum shown in
Fig. 3.17c. In the third-highest Mn concentration areas, for example the dashed area
(d), Si and Al concentrations are much higher than Mn concentration, as shown by
the EDX spectrum shown in Fig. 3.17d. In the lowest Mn concentration areas, Si
concentration is high, as shown by the Si element map (Fig. 3.17f) and the EDX
spectrum shown in Fig. 3.17e. Considering the analyses of manganese minerals
(Mn 3 O 4 : 83.2 and 73.2%; Al 2 O 3 : 1.0 and 11.5% for birrnessite and lithiophorite,
respectively (McKenzie 1989)) and the results from the sequential selective dissolution analyses (Fig. 3.15), the major component of the dashed areas shown in
Fig. 3.17b, c can be related to birnesite and lithiophorite, respectively. The major
components of the areas of the EDX spectra shown in Fig. 3.17d, e can be related to a
dioctahedral micaceous mineral (Fig. 3.15g) and fine silica particles, respectively.
Fig. 3.17 EDX analyses with higher magnification. (a) magnified element map of Mn of the
dashed square in Fig. 3.16f, (b, c, and d) EDX spectra obtained from the dashed squares (b), (c), and
(d) in (a), (e) EDX spectrum obtained from the dashed square (e) in the Si element map (f) of the
same area as in (a)
56
3 Secondary Minerals