

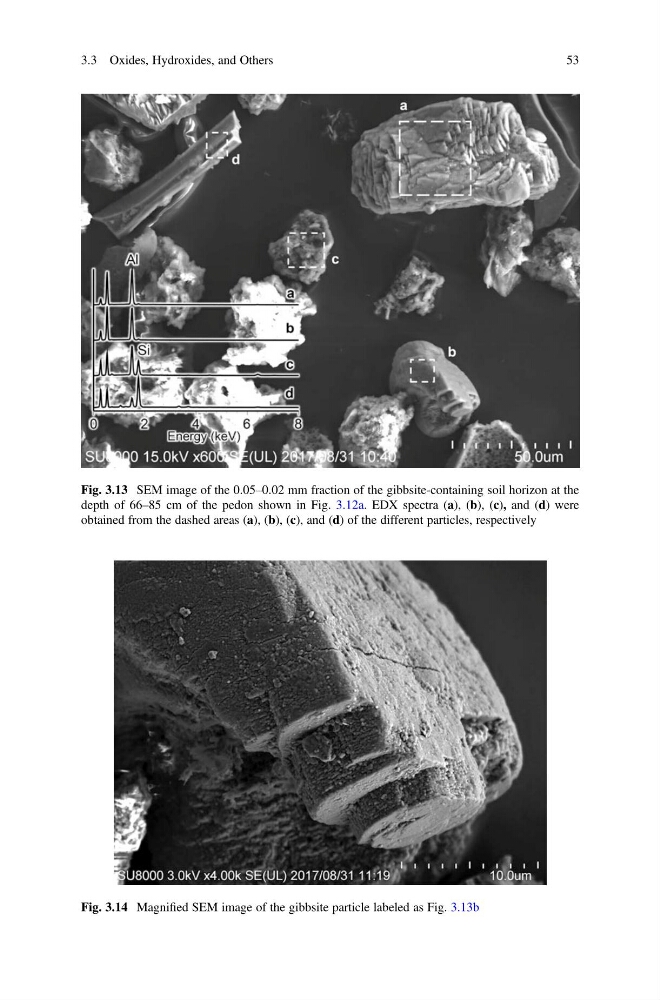
Fig. 3.13 SEM image of the 0.05–0.02 mm fraction of the gibbsite-containing soil horizon at the
depth of 66–85 cm of the pedon shown in Fig. 3.12a. EDX spectra (a), (b), (c), and (d) were
obtained from the dashed areas (a), (b), (c), and (d) of the different particles, respectively
Fig. 3.14 Magnified SEM image of the gibbsite particle labeled as Fig. 3.13b
3.3 Oxides, Hydroxides, and Others
53
depth of 66–85 cm of the pedon shown in Fig. 3.12a. EDX spectra (a), (b), (c), and (d) were
obtained from the dashed areas (a), (b), (c), and (d) of the different particles, respectively
Fig. 3.14 Magnified SEM image of the gibbsite particle labeled as Fig. 3.13b
3.3 Oxides, Hydroxides, and Others
53