

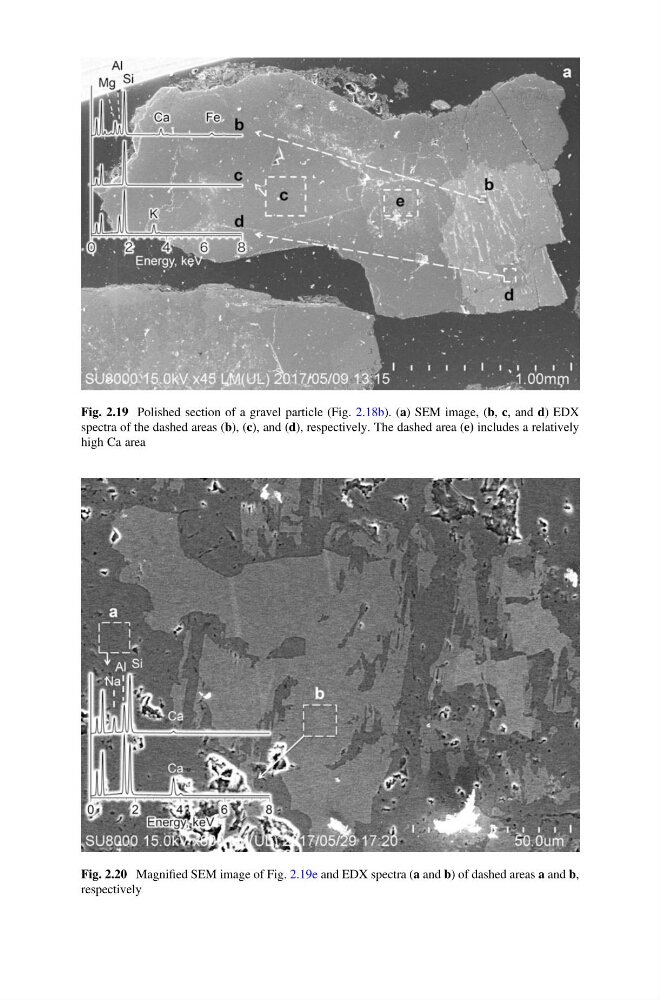
Fig. 2.19 Polished section of a gravel particle (Fig. 2.18b). (a) SEM image, (b, c, and d) EDX
spectra of the dashed areas (b), (c), and (d), respectively. The dashed area (e) includes a relatively
high Ca area
Fig. 2.20 Magnified SEM image of Fig. 2.19e and EDX spectra (a and b) of dashed areas a and b,
respectively
spectra of the dashed areas (b), (c), and (d), respectively. The dashed area (e) includes a relatively
high Ca area
Fig. 2.20 Magnified SEM image of Fig. 2.19e and EDX spectra (a and b) of dashed areas a and b,
respectively