

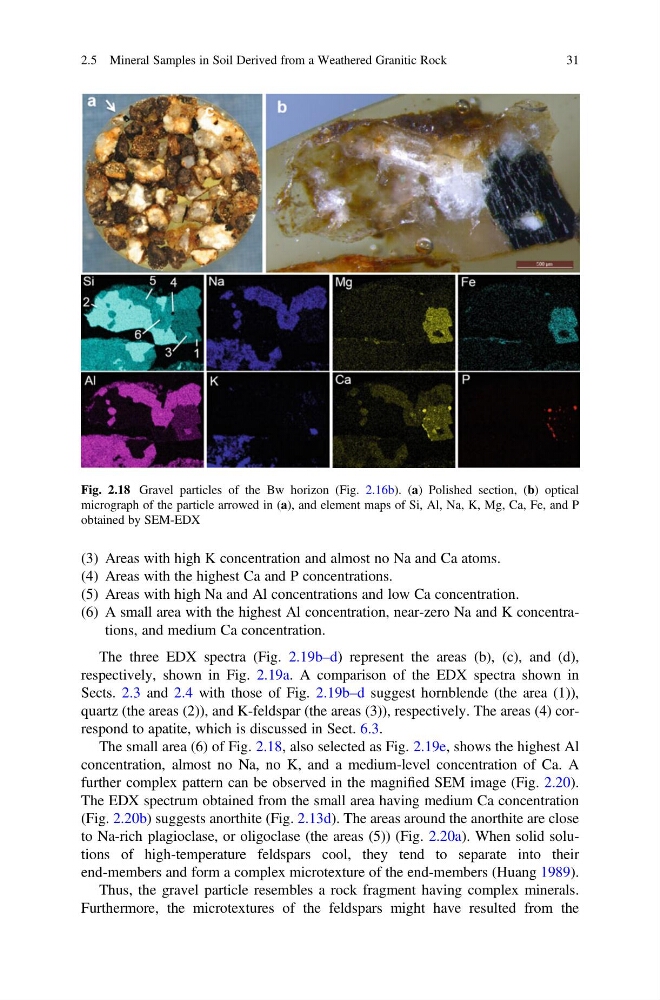
(3) Areas with high K concentration and almost no Na and Ca atoms.
(4) Areas with the highest Ca and P concentrations.
(5) Areas with high Na and Al concentrations and low Ca concentration.
(6) A small area with the highest Al concentration, near-zero Na and K concentrations, and medium Ca concentration.
The three EDX spectra (Fig. 2.19b–d) represent the areas (b), (c), and (d),
respectively, shown in Fig. 2.19a. A comparison of the EDX spectra shown in
Sects. 2.3 and 2.4 with those of Fig. 2.19b–d suggest hornblende (the area (1)),
quartz (the areas (2)), and K-feldspar (the areas (3)), respectively. The areas (4) correspond to apatite, which is discussed in Sect. 6.3.
The small area (6) of Fig. 2.18, also selected as Fig. 2.19e, shows the highest Al
concentration, almost no Na, no K, and a medium-level concentration of Ca. A
further complex pattern can be observed in the magnified SEM image (Fig. 2.20).
The EDX spectrum obtained from the small area having medium Ca concentration
(Fig. 2.20b) suggests anorthite (Fig. 2.13d). The areas around the anorthite are close
to Na-rich plagioclase, or oligoclase (the areas (5)) (Fig. 2.20a). When solid solutions of high-temperature feldspars cool, they tend to separate into their
end-members and form a complex microtexture of the end-members (Huang 1989).
Thus, the gravel particle resembles a rock fragment having complex minerals.
Furthermore, the microtextures of the feldspars might have resulted from the
Fig. 2.18 Gravel particles of the Bw horizon (Fig. 2.16b). (a) Polished section, (b) optical
micrograph of the particle arrowed in (a), and element maps of Si, Al, Na, K, Mg, Ca, Fe, and P
obtained by SEM-EDX
2.5 Mineral Samples in Soil Derived from a Weathered Granitic Rock
31
(4) Areas with the highest Ca and P concentrations.
(5) Areas with high Na and Al concentrations and low Ca concentration.
(6) A small area with the highest Al concentration, near-zero Na and K concentrations, and medium Ca concentration.
The three EDX spectra (Fig. 2.19b–d) represent the areas (b), (c), and (d),
respectively, shown in Fig. 2.19a. A comparison of the EDX spectra shown in
Sects. 2.3 and 2.4 with those of Fig. 2.19b–d suggest hornblende (the area (1)),
quartz (the areas (2)), and K-feldspar (the areas (3)), respectively. The areas (4) correspond to apatite, which is discussed in Sect. 6.3.
The small area (6) of Fig. 2.18, also selected as Fig. 2.19e, shows the highest Al
concentration, almost no Na, no K, and a medium-level concentration of Ca. A
further complex pattern can be observed in the magnified SEM image (Fig. 2.20).
The EDX spectrum obtained from the small area having medium Ca concentration
(Fig. 2.20b) suggests anorthite (Fig. 2.13d). The areas around the anorthite are close
to Na-rich plagioclase, or oligoclase (the areas (5)) (Fig. 2.20a). When solid solutions of high-temperature feldspars cool, they tend to separate into their
end-members and form a complex microtexture of the end-members (Huang 1989).
Thus, the gravel particle resembles a rock fragment having complex minerals.
Furthermore, the microtextures of the feldspars might have resulted from the
Fig. 2.18 Gravel particles of the Bw horizon (Fig. 2.16b). (a) Polished section, (b) optical
micrograph of the particle arrowed in (a), and element maps of Si, Al, Na, K, Mg, Ca, Fe, and P
obtained by SEM-EDX
2.5 Mineral Samples in Soil Derived from a Weathered Granitic Rock
31