

In contrast, when the two apatite samples were treated with 10 mmol L
À1 oxalate,
the amount of P dissolved was much smaller than those of the treatment with citrate
or HCl in the final pH range between 3.4 and 4.3 (Fig. 6.31d). When the final pH was
about 3 with the treatment by citrate or dilute HCl, the amount of P dissolved was
more than 96% of the original P content of the samples. When the final pH was 3.4
with the treatment by oxalate, the amount of P dissolved was only about 10% of the
original P content and was not much different from those at final pH of 6–7. The low
P dissolution with oxalate treatment, compared with the dissolution of citrate or HCl
treatment, was close to the result using the Pinatubo tephra containing apatite of
igneous origin. The formation of a Ca oxalate coating on the surface of apatite from
the oxalate treatment of the Florida apatite was revealed by XRD (Nanzyo et al.
1999). Similar results were also obtained for the Makatea apatite.
The distribution of the Ca oxalate by the oxalate treatment of the apatite samples
was elucidated by SEM-EDX analysis. Figure 6.31a shows an SEM image of the
surface (right-hand side) and the section (left-hand side) of an oxalate-treated Florida
apatite particle at pH4. According to the selected area analysis, the peak intensity for
P-Kα of the surface of the particle (dashed square (b) in Fig. 6.31a) was much
3000
2000
1000
0
0
200
400
600
800
Total P content (mg P2O5 kg )
-1
Truog P (mg P
2 O
5 kg -1
)
c
a
b
d
c
d
0
2
4
6
8
Ti
Fe
P
Ca
Energy (keV)
e
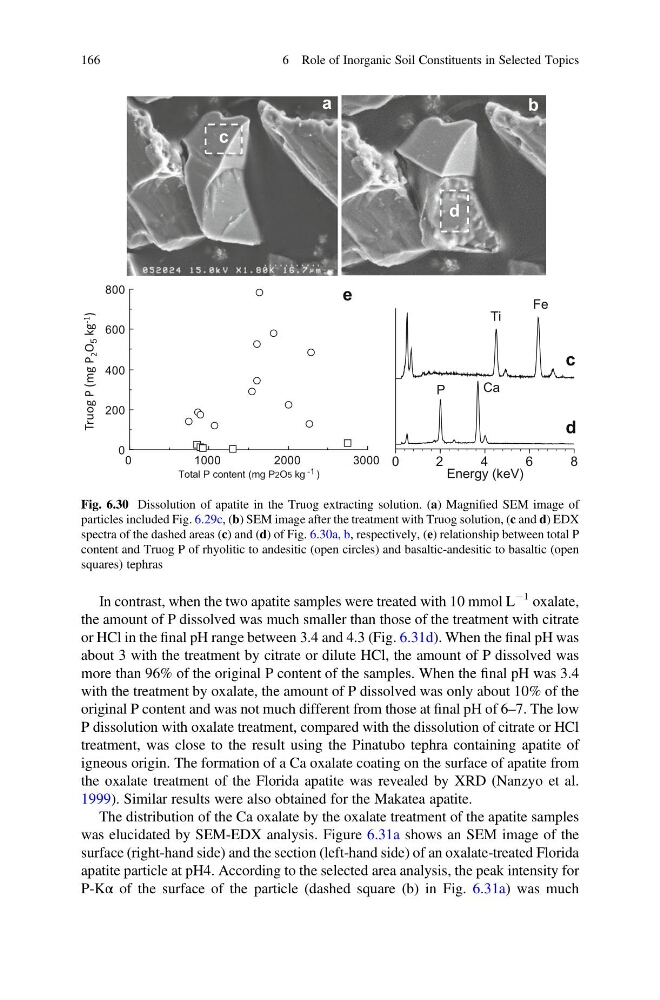
Fig. 6.30 Dissolution of apatite in the Truog extracting solution. (a) Magnified SEM image of
particles included Fig. 6.29c, (b) SEM image after the treatment with Truog solution, (c and d) EDX
spectra of the dashed areas (c) and (d) of Fig. 6.30a, b, respectively, (e) relationship between total P
content and Truog P of rhyolitic to andesitic (open circles) and basaltic-andesitic to basaltic (open
squares) tephras
166
6 Role of Inorganic Soil Constituents in Selected Topics
À1 oxalate,
the amount of P dissolved was much smaller than those of the treatment with citrate
or HCl in the final pH range between 3.4 and 4.3 (Fig. 6.31d). When the final pH was
about 3 with the treatment by citrate or dilute HCl, the amount of P dissolved was
more than 96% of the original P content of the samples. When the final pH was 3.4
with the treatment by oxalate, the amount of P dissolved was only about 10% of the
original P content and was not much different from those at final pH of 6–7. The low
P dissolution with oxalate treatment, compared with the dissolution of citrate or HCl
treatment, was close to the result using the Pinatubo tephra containing apatite of
igneous origin. The formation of a Ca oxalate coating on the surface of apatite from
the oxalate treatment of the Florida apatite was revealed by XRD (Nanzyo et al.
1999). Similar results were also obtained for the Makatea apatite.
The distribution of the Ca oxalate by the oxalate treatment of the apatite samples
was elucidated by SEM-EDX analysis. Figure 6.31a shows an SEM image of the
surface (right-hand side) and the section (left-hand side) of an oxalate-treated Florida
apatite particle at pH4. According to the selected area analysis, the peak intensity for
P-Kα of the surface of the particle (dashed square (b) in Fig. 6.31a) was much
3000
2000
1000
0
0
200
400
600
800
Total P content (mg P2O5 kg )
-1
Truog P (mg P
2 O
5 kg -1
)
c
a
b
d
c
d
0
2
4
6
8
Ti
Fe
P
Ca
Energy (keV)
e
Fig. 6.30 Dissolution of apatite in the Truog extracting solution. (a) Magnified SEM image of
particles included Fig. 6.29c, (b) SEM image after the treatment with Truog solution, (c and d) EDX
spectra of the dashed areas (c) and (d) of Fig. 6.30a, b, respectively, (e) relationship between total P
content and Truog P of rhyolitic to andesitic (open circles) and basaltic-andesitic to basaltic (open
squares) tephras
166
6 Role of Inorganic Soil Constituents in Selected Topics