

be more comparable to that of the WTR from a water purification plant, considering
their particle size. Hence, the concentration of radiocesium per clay fraction was
calculated by dividing the concentration of radiocesium in each layer by the clay
content of the layer. The results are shown in Figs. 6.25b and 6.26b. The radiocesium
per clay fraction was more than five times greater than that in the fine earth fraction
(particle diameter ≦ 2 mm). For UGD, the concentration of radiocesium in the clay
fraction was high in the earlier (lower) muddy layers, UGD-7 and UGD-8. High
concentrations of radiocesium per clay fraction continued into the sandy UGD-6
layer, after which the concentrations decreased (Fig. 6.25b).
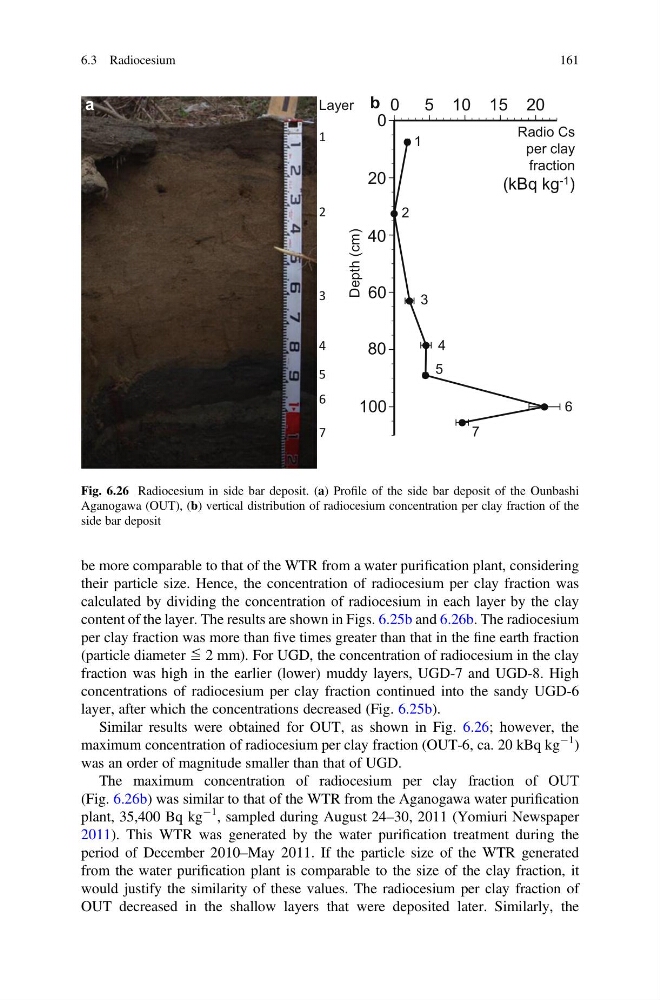
Similar results were obtained for OUT, as shown in Fig. 6.26; however, the
maximum concentration of radiocesium per clay fraction (OUT-6, ca. 20 kBq kg
À1 )
was an order of magnitude smaller than that of UGD.
The maximum concentration of radiocesium per clay fraction of OUT
(Fig. 6.26b) was similar to that of the WTR from the Aganogawa water purification
plant, 35,400 Bq kg
À1 , sampled during August 24–30, 2011 (Yomiuri Newspaper
2011). This WTR was generated by the water purification treatment during the
period of December 2010–May 2011. If the particle size of the WTR generated
from the water purification plant is comparable to the size of the clay fraction, it
would justify the similarity of these values. The radiocesium per clay fraction of
OUT decreased in the shallow layers that were deposited later. Similarly, the
0
20
40
80
100
Depth (cm)
Radio Cs
per clay
fraction
(kBq kg -1 )
0 5 10 15 20
60
1
2
3
4
5
6
7
Layer
1
2
3
4
5
6
7
b
a
Fig. 6.26 Radiocesium in side bar deposit. (a) Profile of the side bar deposit of the Ounbashi
Aganogawa (OUT), (b) vertical distribution of radiocesium concentration per clay fraction of the
side bar deposit
6.3 Radiocesium
161
their particle size. Hence, the concentration of radiocesium per clay fraction was
calculated by dividing the concentration of radiocesium in each layer by the clay
content of the layer. The results are shown in Figs. 6.25b and 6.26b. The radiocesium
per clay fraction was more than five times greater than that in the fine earth fraction
(particle diameter ≦ 2 mm). For UGD, the concentration of radiocesium in the clay
fraction was high in the earlier (lower) muddy layers, UGD-7 and UGD-8. High
concentrations of radiocesium per clay fraction continued into the sandy UGD-6
layer, after which the concentrations decreased (Fig. 6.25b).
Similar results were obtained for OUT, as shown in Fig. 6.26; however, the
maximum concentration of radiocesium per clay fraction (OUT-6, ca. 20 kBq kg
À1 )
was an order of magnitude smaller than that of UGD.
The maximum concentration of radiocesium per clay fraction of OUT
(Fig. 6.26b) was similar to that of the WTR from the Aganogawa water purification
plant, 35,400 Bq kg
À1 , sampled during August 24–30, 2011 (Yomiuri Newspaper
2011). This WTR was generated by the water purification treatment during the
period of December 2010–May 2011. If the particle size of the WTR generated
from the water purification plant is comparable to the size of the clay fraction, it
would justify the similarity of these values. The radiocesium per clay fraction of
OUT decreased in the shallow layers that were deposited later. Similarly, the
0
20
40
80
100
Depth (cm)
Radio Cs
per clay
fraction
(kBq kg -1 )
0 5 10 15 20
60
1
2
3
4
5
6
7
Layer
1
2
3
4
5
6
7
b
a
Fig. 6.26 Radiocesium in side bar deposit. (a) Profile of the side bar deposit of the Ounbashi
Aganogawa (OUT), (b) vertical distribution of radiocesium concentration per clay fraction of the
side bar deposit
6.3 Radiocesium
161