

Yamamoto, for example, were a type of artifact formed during handling of the
sample or were from some other cause.
Because the radioactivity of spots of samples 20A and 23A was so intensive, the
vertical distribution of radioactivity was examined using 2–3 mm thick horizontal
sections of four samples (2A, 23A, 20A, and S5A), as exemplified in Fig. 6.18f, g, h.
The same gamma-ray spectrometry used for Fig. 6.19 was used for radiocesium
measurement of the horizontal sections. The results are shown in Fig. 6.21. As
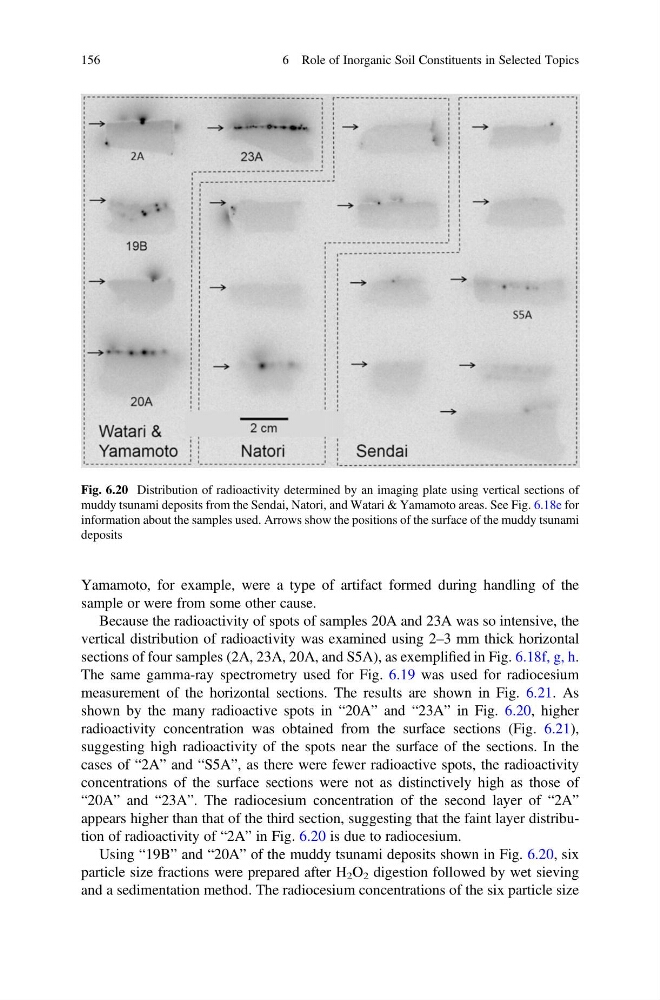
shown by the many radioactive spots in “20A” and “23A” in Fig. 6.20, higher
radioactivity concentration was obtained from the surface sections (Fig. 6.21),
suggesting high radioactivity of the spots near the surface of the sections. In the
cases of “2A” and “S5A”, as there were fewer radioactive spots, the radioactivity
concentrations of the surface sections were not as distinctively high as those of
“20A” and “23A”. The radiocesium concentration of the second layer of “2A”
appears higher than that of the third section, suggesting that the faint layer distribution of radioactivity of “2A” in Fig. 6.20 is due to radiocesium.
Using “19B” and “20A” of the muddy tsunami deposits shown in Fig. 6.20, six
particle size fractions were prepared after H 2 O 2 digestion followed by wet sieving
and a sedimentation method. The radiocesium concentrations of the six particle size
Fig. 6.20 Distribution of radioactivity determined by an imaging plate using vertical sections of
muddy tsunami deposits from the Sendai, Natori, and Watari & Yamamoto areas. See Fig. 6.18e for
information about the samples used. Arrows show the positions of the surface of the muddy tsunami
deposits
156
6 Role of Inorganic Soil Constituents in Selected Topics
sample or were from some other cause.
Because the radioactivity of spots of samples 20A and 23A was so intensive, the
vertical distribution of radioactivity was examined using 2–3 mm thick horizontal
sections of four samples (2A, 23A, 20A, and S5A), as exemplified in Fig. 6.18f, g, h.
The same gamma-ray spectrometry used for Fig. 6.19 was used for radiocesium
measurement of the horizontal sections. The results are shown in Fig. 6.21. As
shown by the many radioactive spots in “20A” and “23A” in Fig. 6.20, higher
radioactivity concentration was obtained from the surface sections (Fig. 6.21),
suggesting high radioactivity of the spots near the surface of the sections. In the
cases of “2A” and “S5A”, as there were fewer radioactive spots, the radioactivity
concentrations of the surface sections were not as distinctively high as those of
“20A” and “23A”. The radiocesium concentration of the second layer of “2A”
appears higher than that of the third section, suggesting that the faint layer distribution of radioactivity of “2A” in Fig. 6.20 is due to radiocesium.
Using “19B” and “20A” of the muddy tsunami deposits shown in Fig. 6.20, six
particle size fractions were prepared after H 2 O 2 digestion followed by wet sieving
and a sedimentation method. The radiocesium concentrations of the six particle size
Fig. 6.20 Distribution of radioactivity determined by an imaging plate using vertical sections of
muddy tsunami deposits from the Sendai, Natori, and Watari & Yamamoto areas. See Fig. 6.18e for
information about the samples used. Arrows show the positions of the surface of the muddy tsunami
deposits
156
6 Role of Inorganic Soil Constituents in Selected Topics