

sections were attached to one side of a strip of double-sided adhesive tape, attached
to cardboard using the other side of the tape, and then covered by a thin plastic sheet.
The cardboard was placed on an imaging plate (IP) for 30 days to detect radioactivity
(see Sect. 1.4).
The IP results of the vertical sections revealed two distribution patterns of
radioactivity (Fig. 6.20). One pattern was a line of spots with high radioactivity
near the surface of the muddy layer. The radioactivity of these spots was sufficiently
high to indicate that the radioactivity was from radiocesium. The distribution of
these spots suggests that a significant fraction of the radiocesium had been deposited
as particulate material (Adachi et al. 2013) and that deposition of the radioactive
particulate material occurred after the sedimentation of the muddy tsunami deposit.
The other pattern was a very faint, layer distribution at the upper part of the vertical
section. If this radioactivity was also from radiocesium, the radiocesium may have
been deposited in a soluble form and become fixed by suspended soil materials in the
inundation water during sedimentation (Mukai et al. 2016). It was not clear whether
a few spots showing radioactivity at the side edge of “2A” from Watari &
Tagajo
Shichigahama
Sendai
Iwanuma
Natori
Watari
Yamamoto
0
2000 4000 6000 8000
0
5
10
15
20
25
Sendai
137 Cs+ 134 Cs (Bq kg -1 )
Depth (cm)
0
2000 4000 6000 8000
0
5
10
15
20
25
Natori
0 2000 4000 6000 8000
Watari & Yamamoto
0
5
10
15
20
25
a
b
c
d
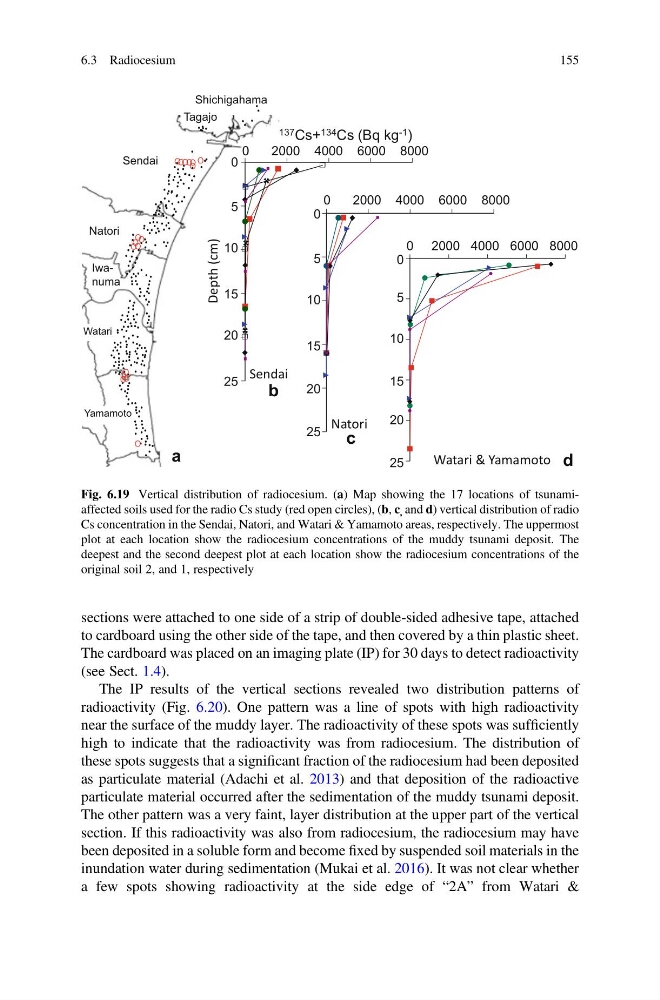
Fig. 6.19 Vertical distribution of radiocesium. (a) Map showing the 17 locations of tsunamiaffected soils used for the radio Cs study (red open circles), (b, c , and d) vertical distribution of radio
Cs concentration in the Sendai, Natori, and Watari & Yamamoto areas, respectively. The uppermost
plot at each location show the radiocesium concentrations of the muddy tsunami deposit. The
deepest and the second deepest plot at each location show the radiocesium concentrations of the
original soil 2, and 1, respectively
6.3 Radiocesium
155
to cardboard using the other side of the tape, and then covered by a thin plastic sheet.
The cardboard was placed on an imaging plate (IP) for 30 days to detect radioactivity
(see Sect. 1.4).
The IP results of the vertical sections revealed two distribution patterns of
radioactivity (Fig. 6.20). One pattern was a line of spots with high radioactivity
near the surface of the muddy layer. The radioactivity of these spots was sufficiently
high to indicate that the radioactivity was from radiocesium. The distribution of
these spots suggests that a significant fraction of the radiocesium had been deposited
as particulate material (Adachi et al. 2013) and that deposition of the radioactive
particulate material occurred after the sedimentation of the muddy tsunami deposit.
The other pattern was a very faint, layer distribution at the upper part of the vertical
section. If this radioactivity was also from radiocesium, the radiocesium may have
been deposited in a soluble form and become fixed by suspended soil materials in the
inundation water during sedimentation (Mukai et al. 2016). It was not clear whether
a few spots showing radioactivity at the side edge of “2A” from Watari &
Tagajo
Shichigahama
Sendai
Iwanuma
Natori
Watari
Yamamoto
0
2000 4000 6000 8000
0
5
10
15
20
25
Sendai
137 Cs+ 134 Cs (Bq kg -1 )
Depth (cm)
0
2000 4000 6000 8000
0
5
10
15
20
25
Natori
0 2000 4000 6000 8000
Watari & Yamamoto
0
5
10
15
20
25
a
b
c
d
Fig. 6.19 Vertical distribution of radiocesium. (a) Map showing the 17 locations of tsunamiaffected soils used for the radio Cs study (red open circles), (b, c , and d) vertical distribution of radio
Cs concentration in the Sendai, Natori, and Watari & Yamamoto areas, respectively. The uppermost
plot at each location show the radiocesium concentrations of the muddy tsunami deposit. The
deepest and the second deepest plot at each location show the radiocesium concentrations of the
original soil 2, and 1, respectively
6.3 Radiocesium
155