

Prefecture. The area is located between 50 and 100 km north of the FNPP (Fig. 6.17),
and it is the same as in Fig. 6.4b. Although the tsunami deposits were mostly
removed from the farmland in Miyagi Prefecture, the distribution of radiocesium
in these soils may need to be taken into account in subsequent management of the
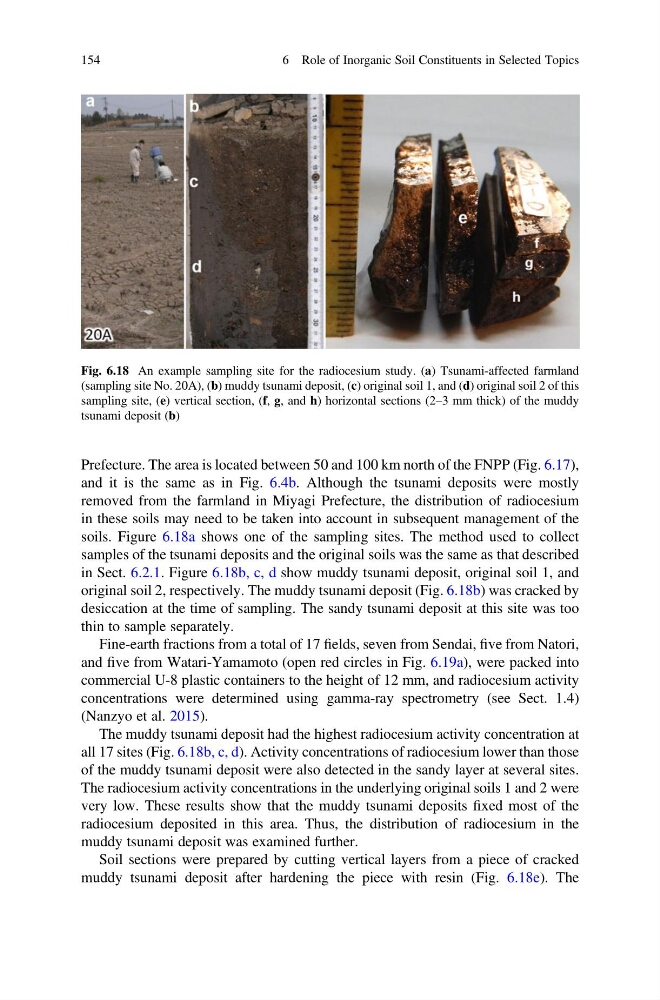
soils. Figure 6.18a shows one of the sampling sites. The method used to collect
samples of the tsunami deposits and the original soils was the same as that described
in Sect. 6.2.1. Figure 6.18b, c, d show muddy tsunami deposit, original soil 1, and
original soil 2, respectively. The muddy tsunami deposit (Fig. 6.18b) was cracked by
desiccation at the time of sampling. The sandy tsunami deposit at this site was too
thin to sample separately.
Fine-earth fractions from a total of 17 fields, seven from Sendai, five from Natori,
and five from Watari-Yamamoto (open red circles in Fig. 6.19a), were packed into
commercial U-8 plastic containers to the height of 12 mm, and radiocesium activity
concentrations were determined using gamma-ray spectrometry (see Sect. 1.4)
(Nanzyo et al. 2015).
The muddy tsunami deposit had the highest radiocesium activity concentration at
all 17 sites (Fig. 6.18b, c, d). Activity concentrations of radiocesium lower than those
of the muddy tsunami deposit were also detected in the sandy layer at several sites.
The radiocesium activity concentrations in the underlying original soils 1 and 2 were
very low. These results show that the muddy tsunami deposits fixed most of the
radiocesium deposited in this area. Thus, the distribution of radiocesium in the
muddy tsunami deposit was examined further.
Soil sections were prepared by cutting vertical layers from a piece of cracked
muddy tsunami deposit after hardening the piece with resin (Fig. 6.18e). The
Fig. 6.18 An example sampling site for the radiocesium study. (a) Tsunami-affected farmland
(sampling site No. 20A), (b) muddy tsunami deposit, (c) original soil 1, and (d) original soil 2 of this
sampling site, (e) vertical section, (f, g, and h) horizontal sections (2–3 mm thick) of the muddy
tsunami deposit (b)
154
6 Role of Inorganic Soil Constituents in Selected Topics
and it is the same as in Fig. 6.4b. Although the tsunami deposits were mostly
removed from the farmland in Miyagi Prefecture, the distribution of radiocesium
in these soils may need to be taken into account in subsequent management of the
soils. Figure 6.18a shows one of the sampling sites. The method used to collect
samples of the tsunami deposits and the original soils was the same as that described
in Sect. 6.2.1. Figure 6.18b, c, d show muddy tsunami deposit, original soil 1, and
original soil 2, respectively. The muddy tsunami deposit (Fig. 6.18b) was cracked by
desiccation at the time of sampling. The sandy tsunami deposit at this site was too
thin to sample separately.
Fine-earth fractions from a total of 17 fields, seven from Sendai, five from Natori,
and five from Watari-Yamamoto (open red circles in Fig. 6.19a), were packed into
commercial U-8 plastic containers to the height of 12 mm, and radiocesium activity
concentrations were determined using gamma-ray spectrometry (see Sect. 1.4)
(Nanzyo et al. 2015).
The muddy tsunami deposit had the highest radiocesium activity concentration at
all 17 sites (Fig. 6.18b, c, d). Activity concentrations of radiocesium lower than those
of the muddy tsunami deposit were also detected in the sandy layer at several sites.
The radiocesium activity concentrations in the underlying original soils 1 and 2 were
very low. These results show that the muddy tsunami deposits fixed most of the
radiocesium deposited in this area. Thus, the distribution of radiocesium in the
muddy tsunami deposit was examined further.
Soil sections were prepared by cutting vertical layers from a piece of cracked
muddy tsunami deposit after hardening the piece with resin (Fig. 6.18e). The
Fig. 6.18 An example sampling site for the radiocesium study. (a) Tsunami-affected farmland
(sampling site No. 20A), (b) muddy tsunami deposit, (c) original soil 1, and (d) original soil 2 of this
sampling site, (e) vertical section, (f, g, and h) horizontal sections (2–3 mm thick) of the muddy
tsunami deposit (b)
154
6 Role of Inorganic Soil Constituents in Selected Topics