

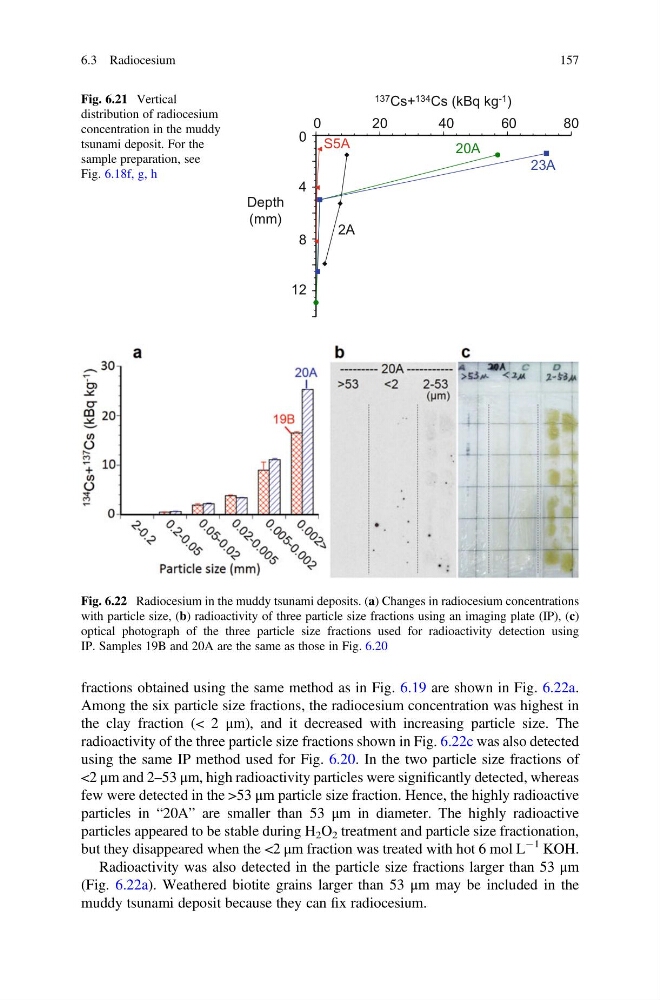
fractions obtained using the same method as in Fig. 6.19 are shown in Fig. 6.22a.
Among the six particle size fractions, the radiocesium concentration was highest in
the clay fraction (< 2 μm), and it decreased with increasing particle size. The
radioactivity of the three particle size fractions shown in Fig. 6.22c was also detected
using the same IP method used for Fig. 6.20. In the two particle size fractions of
<2 μm and 2–53 μm, high radioactivity particles were significantly detected, whereas
few were detected in the >53 μm particle size fraction. Hence, the highly radioactive
particles in “20A” are smaller than 53 μm in diameter. The highly radioactive
particles appeared to be stable during H 2 O 2 treatment and particle size fractionation,
but they disappeared when the <2 μm fraction was treated with hot 6 mol L
À1 KOH.
Radioactivity was also detected in the particle size fractions larger than 53 μm
(Fig. 6.22a). Weathered biotite grains larger than 53 μm may be included in the
muddy tsunami deposit because they can fix radiocesium.
0
2 0
4 0
6 0
80
0
4
8
12
Depth
(mm)
137 Cs+ 134 Cs (kBq kg -1 )
2A
S5A
23A
20A
Fig. 6.21 Vertical
distribution of radiocesium
concentration in the muddy
tsunami deposit. For the
sample preparation, see
Fig. 6.18f, g, h
Fig. 6.22 Radiocesium in the muddy tsunami deposits. (a) Changes in radiocesium concentrations
with particle size, (b) radioactivity of three particle size fractions using an imaging plate (IP), (c)
optical photograph of the three particle size fractions used for radioactivity detection using
IP. Samples 19B and 20A are the same as those in Fig. 6.20
6.3 Radiocesium
157
Among the six particle size fractions, the radiocesium concentration was highest in
the clay fraction (< 2 μm), and it decreased with increasing particle size. The
radioactivity of the three particle size fractions shown in Fig. 6.22c was also detected
using the same IP method used for Fig. 6.20. In the two particle size fractions of
<2 μm and 2–53 μm, high radioactivity particles were significantly detected, whereas
few were detected in the >53 μm particle size fraction. Hence, the highly radioactive
particles in “20A” are smaller than 53 μm in diameter. The highly radioactive
particles appeared to be stable during H 2 O 2 treatment and particle size fractionation,
but they disappeared when the <2 μm fraction was treated with hot 6 mol L
À1 KOH.
Radioactivity was also detected in the particle size fractions larger than 53 μm
(Fig. 6.22a). Weathered biotite grains larger than 53 μm may be included in the
muddy tsunami deposit because they can fix radiocesium.
0
2 0
4 0
6 0
80
0
4
8
12
Depth
(mm)
137 Cs+ 134 Cs (kBq kg -1 )
2A
S5A
23A
20A
Fig. 6.21 Vertical
distribution of radiocesium
concentration in the muddy
tsunami deposit. For the
sample preparation, see
Fig. 6.18f, g, h
Fig. 6.22 Radiocesium in the muddy tsunami deposits. (a) Changes in radiocesium concentrations
with particle size, (b) radioactivity of three particle size fractions using an imaging plate (IP), (c)
optical photograph of the three particle size fractions used for radioactivity detection using
IP. Samples 19B and 20A are the same as those in Fig. 6.20
6.3 Radiocesium
157