

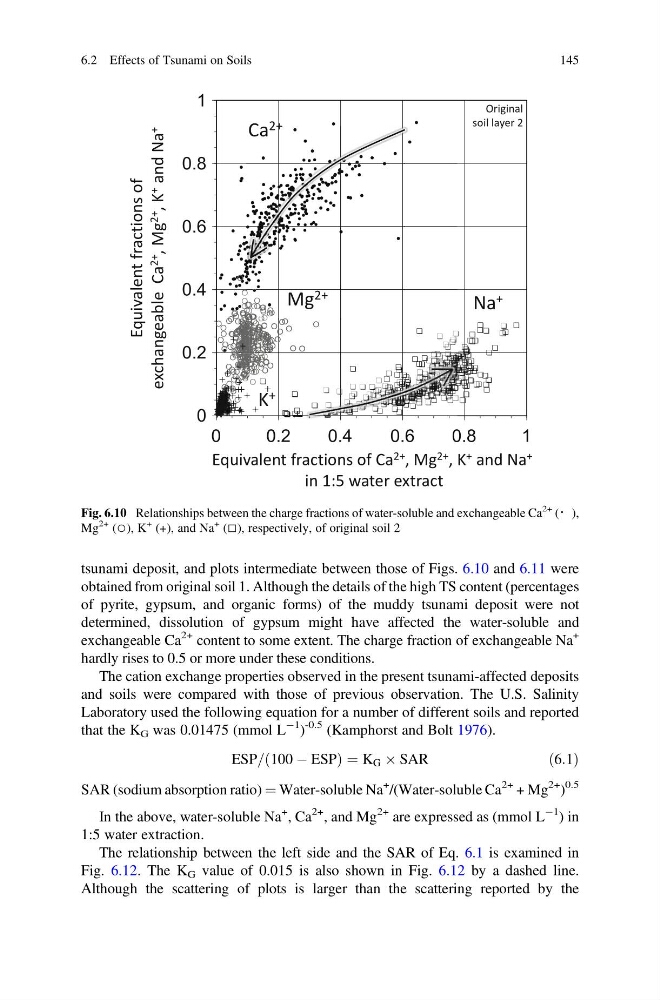
tsunami deposit, and plots intermediate between those of Figs. 6.10 and 6.11 were
obtained from original soil 1. Although the details of the high TS content (percentages
of pyrite, gypsum, and organic forms) of the muddy tsunami deposit were not
determined, dissolution of gypsum might have affected the water-soluble and
exchangeable Ca
2+ content to some extent. The charge fraction of exchangeable Na
+
hardly rises to 0.5 or more under these conditions.
The cation exchange properties observed in the present tsunami-affected deposits
and soils were compared with those of previous observation. The U.S. Salinity
Laboratory used the following equation for a number of different soils and reported
that the K G was 0.01475 (mmol L
À1
)
-0.5 (Kamphorst and Bolt 1976).
ESP= 100 À ESP
ð
Þ¼K G Â SAR
ð6:1Þ
SAR (sodium absorption ratio) ¼ Water-soluble Na
+
/(Water-soluble Ca
2+ + Mg
2+ )
0.5
In the above, water-soluble Na
+ , Ca
2+ , and Mg
2+ are expressed as (mmol L
À1 ) in
1:5 water extraction.
The relationship between the left side and the SAR of Eq. 6.1 is examined in
Fig. 6.12. The K G value of 0.015 is also shown in Fig. 6.12 by a dashed line.
Although the scattering of plots is larger than the scattering reported by the
Original
soil layer 2
Equivalent fractions of Ca 2+ , Mg 2+ , K + and Na +
in 1:5 water extract
Equivalent fractions of
exchangeable Ca 2+
, Mg 2+
, K +
and Na +
Na +
Ca 2+
Mg 2+
K +
Fig. 6.10 Relationships between the charge fractions of water-soluble and exchangeable Ca
2+ (・),
Mg
2+ (○), K
+ (+), and Na
+ (□), respectively, of original soil 2
6.2 Effects of Tsunami on Soils
145
obtained from original soil 1. Although the details of the high TS content (percentages
of pyrite, gypsum, and organic forms) of the muddy tsunami deposit were not
determined, dissolution of gypsum might have affected the water-soluble and
exchangeable Ca
2+ content to some extent. The charge fraction of exchangeable Na
+
hardly rises to 0.5 or more under these conditions.
The cation exchange properties observed in the present tsunami-affected deposits
and soils were compared with those of previous observation. The U.S. Salinity
Laboratory used the following equation for a number of different soils and reported
that the K G was 0.01475 (mmol L
À1
)
-0.5 (Kamphorst and Bolt 1976).
ESP= 100 À ESP
ð
Þ¼K G Â SAR
ð6:1Þ
SAR (sodium absorption ratio) ¼ Water-soluble Na
+
/(Water-soluble Ca
2+ + Mg
2+ )
0.5
In the above, water-soluble Na
+ , Ca
2+ , and Mg
2+ are expressed as (mmol L
À1 ) in
1:5 water extraction.
The relationship between the left side and the SAR of Eq. 6.1 is examined in
Fig. 6.12. The K G value of 0.015 is also shown in Fig. 6.12 by a dashed line.
Although the scattering of plots is larger than the scattering reported by the
Original
soil layer 2
Equivalent fractions of Ca 2+ , Mg 2+ , K + and Na +
in 1:5 water extract
Equivalent fractions of
exchangeable Ca 2+
, Mg 2+
, K +
and Na +
Na +
Ca 2+
Mg 2+
K +
Fig. 6.10 Relationships between the charge fractions of water-soluble and exchangeable Ca
2+ (・),
Mg
2+ (○), K
+ (+), and Na
+ (□), respectively, of original soil 2
6.2 Effects of Tsunami on Soils
145