

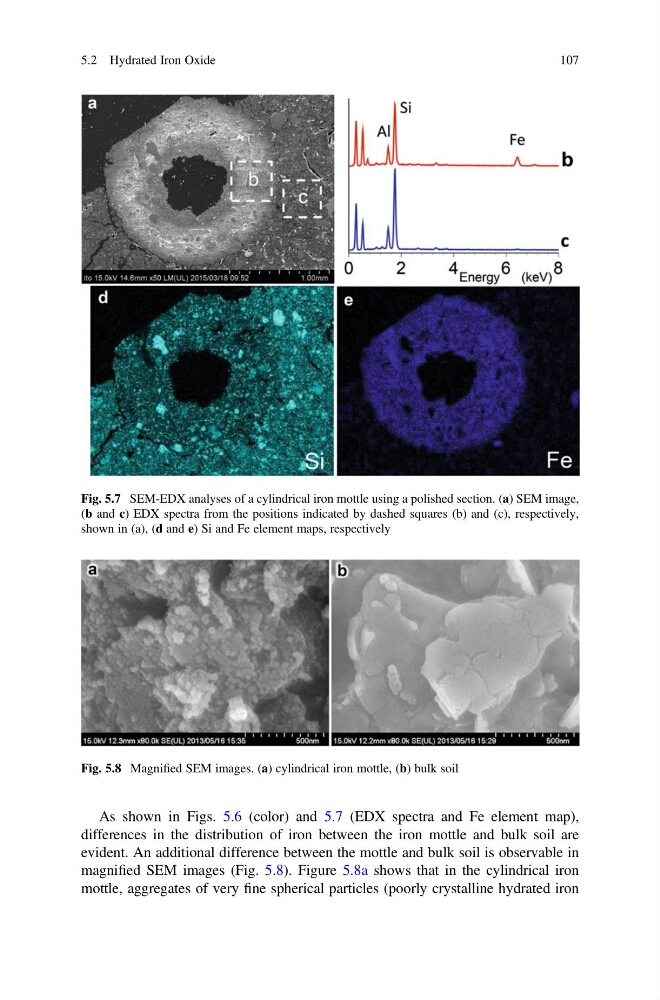
As shown in Figs. 5.6 (color) and 5.7 (EDX spectra and Fe element map),
differences in the distribution of iron between the iron mottle and bulk soil are
evident. An additional difference between the mottle and bulk soil is observable in
magnified SEM images (Fig. 5.8). Figure 5.8a shows that in the cylindrical iron
mottle, aggregates of very fine spherical particles (poorly crystalline hydrated iron
Fig. 5.7 SEM-EDX analyses of a cylindrical iron mottle using a polished section. (a) SEM image,
(b and c) EDX spectra from the positions indicated by dashed squares (b) and (c), respectively,
shown in (a), (d and e) Si and Fe element maps, respectively
Fig. 5.8 Magnified SEM images. (a) cylindrical iron mottle, (b) bulk soil
5.2 Hydrated Iron Oxide
107
differences in the distribution of iron between the iron mottle and bulk soil are
evident. An additional difference between the mottle and bulk soil is observable in
magnified SEM images (Fig. 5.8). Figure 5.8a shows that in the cylindrical iron
mottle, aggregates of very fine spherical particles (poorly crystalline hydrated iron
Fig. 5.7 SEM-EDX analyses of a cylindrical iron mottle using a polished section. (a) SEM image,
(b and c) EDX spectra from the positions indicated by dashed squares (b) and (c), respectively,
shown in (a), (d and e) Si and Fe element maps, respectively
Fig. 5.8 Magnified SEM images. (a) cylindrical iron mottle, (b) bulk soil
5.2 Hydrated Iron Oxide
107