

262
log K,
log K,
_ _
r
(a)
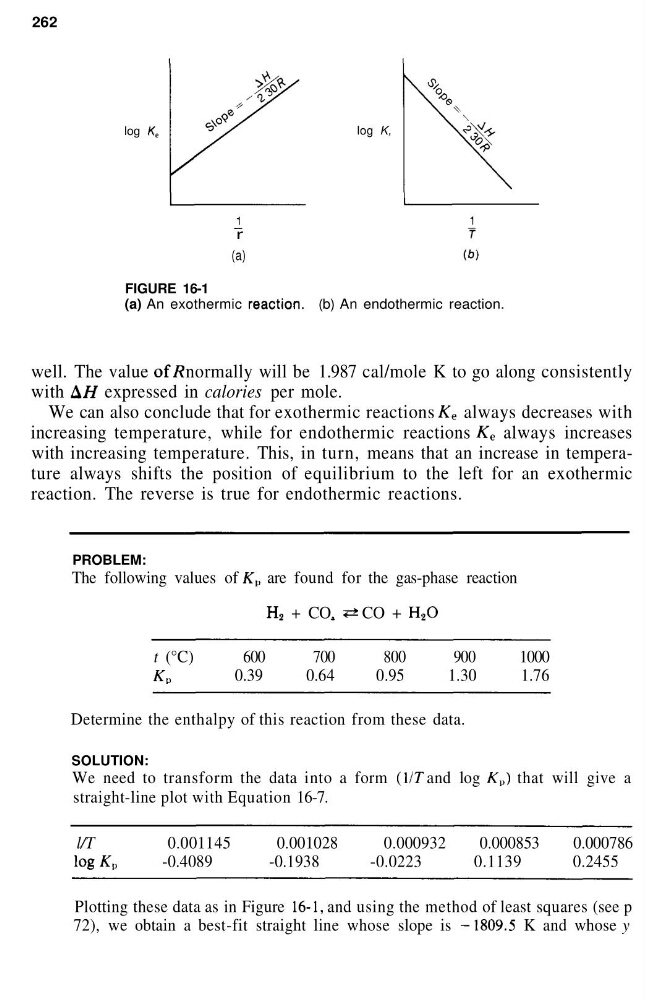
FIGURE 16-1
(a) An exothermic reaction, (b) An endothermic reaction.
well. The value ofR normally will be 1.987 cal/mole K to go along consistently
with A// expressed in calories per mole.
We can also conclude that for exothermic reactions K? always decreases with
increasing temperature, while for endothermic reactions K e always increases
with increasing temperature. This, in turn, means that an increase in temperature always shifts the position of equilibrium to the left for an exothermic
reaction. The reverse is true for endothermic reactions.
PROBLEM:
The following values of K e are found for the gas-phase reaction
H, + CO, ** CO + H,O
t (°C)
600
700
800
900
1000
K v
0.39
0.64
0.95
1.30
1.76
Determine the enthalpy of this reaction from these data.
SOLUTION:
We need to transform the data into a form (l/T and log K v ) that will give a
straight-line plot with Equation 16-7.
l/T
0.001145
0.001028
0.000932
0.000853
0.000786
logKp
-0.4089
-0.1938
-0.0223
0.1139
0.2455
Plotting these data as in Figure 16-1, and using the method of least squares (see p
72), we obtain a best-fit straight line whose slope is -1809.5 K and whose y
log K,
log K,
_ _
r
(a)
FIGURE 16-1
(a) An exothermic reaction, (b) An endothermic reaction.
well. The value ofR normally will be 1.987 cal/mole K to go along consistently
with A// expressed in calories per mole.
We can also conclude that for exothermic reactions K? always decreases with
increasing temperature, while for endothermic reactions K e always increases
with increasing temperature. This, in turn, means that an increase in temperature always shifts the position of equilibrium to the left for an exothermic
reaction. The reverse is true for endothermic reactions.
PROBLEM:
The following values of K e are found for the gas-phase reaction
H, + CO, ** CO + H,O
t (°C)
600
700
800
900
1000
K v
0.39
0.64
0.95
1.30
1.76
Determine the enthalpy of this reaction from these data.
SOLUTION:
We need to transform the data into a form (l/T and log K v ) that will give a
straight-line plot with Equation 16-7.
l/T
0.001145
0.001028
0.000932
0.000853
0.000786
logKp
-0.4089
-0.1938
-0.0223
0.1139
0.2455
Plotting these data as in Figure 16-1, and using the method of least squares (see p
72), we obtain a best-fit straight line whose slope is -1809.5 K and whose y