

Determination of Rate Constant and Order
233
would have been the same because d[A]/d?, d[B]/df , d[C]/d/, d[M]/dr, and so on
are all related to each other through Equation 15-4. There are two general cases
of Equation 15-5 to consider: when a = 1, and when a > 1. We discuss these
cases separately, simplifying to consider only two reactants, A and B.
First-Order Reactions (a = 1)
A value of a = 1 may be obtained in Equation 15-5 under two different situations, as we have noted. First, there is the special circumstance where A is the
only reactant (that is, A is unstable and decomposes without any reaction with
other substances) and where B and C do not exist (thus, k' = k). A common
example of this situation is radioactive decay, in which a given radioactive
isotope spontaneously decomposes into the isotope of another element at a rate
characterized by a rate constant k.
A value of a = 1 can also be obtained in some cases where a reactant B is
involved, under experimental conditions where [B] = [B] e , a concentration
much larger than [A]. We can rearrange Equation 15-5 to separate the variables,
so that only [A] is on the lefthand side of the equation and only t on the
righthand side:
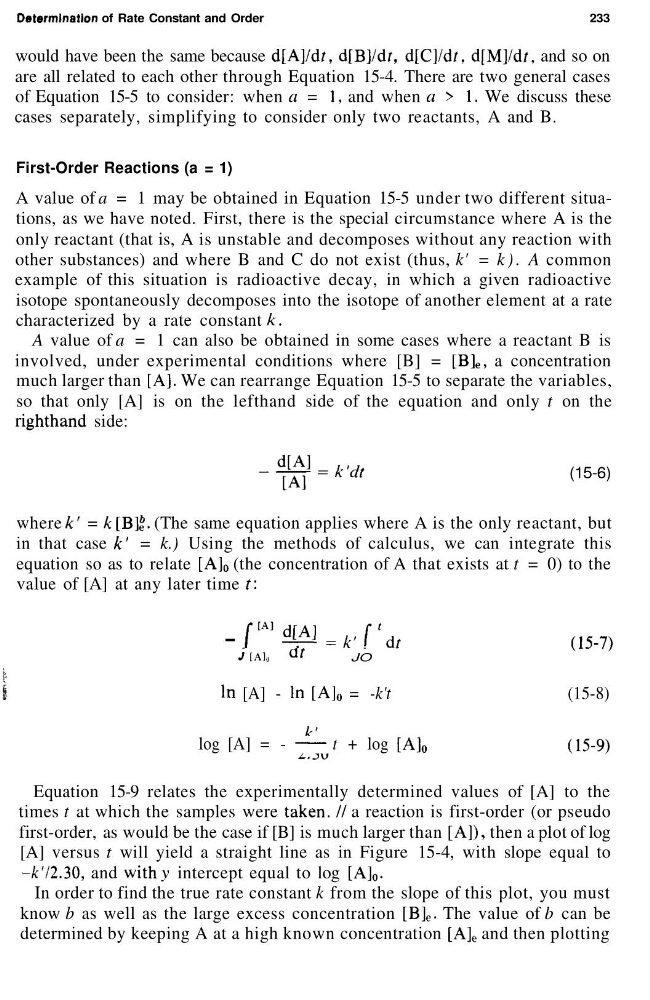
(15-6)
where k' = k[B]%. (The same equation applies where A is the only reactant, but
in that case k' = k.) Using the methods of calculus, we can integrate this
equation so as to relate [A] 0 (the concentration of A that exists at t = 0) to the
value of [A] at any later time t :
- rail-*, f'
JIM,
Qt
JO
,,«,
In [A] - In [A] 0 = -k't
(15-8)
log [A] = - ~ t + log [A] 0
(15-9)
Equation 15-9 relates the experimentally determined values of [A] to the
times t at which the samples were taken. // a reaction is first-order (or pseudo
first-order, as would be the case if [B] is much larger than [ A]) , then a plot of log
[A] versus t will yield a straight line as in Figure 15-4, with slope equal to
-fc'/2.30, and withy intercept equal to log [A] 0 .
In order to find the true rate constant k from the slope of this plot, you must
know b as well as the large excess concentration [B] e . The value of b can be
determined by keeping A at a high known concentration [A] e and then plotting
233
would have been the same because d[A]/d?, d[B]/df , d[C]/d/, d[M]/dr, and so on
are all related to each other through Equation 15-4. There are two general cases
of Equation 15-5 to consider: when a = 1, and when a > 1. We discuss these
cases separately, simplifying to consider only two reactants, A and B.
First-Order Reactions (a = 1)
A value of a = 1 may be obtained in Equation 15-5 under two different situations, as we have noted. First, there is the special circumstance where A is the
only reactant (that is, A is unstable and decomposes without any reaction with
other substances) and where B and C do not exist (thus, k' = k). A common
example of this situation is radioactive decay, in which a given radioactive
isotope spontaneously decomposes into the isotope of another element at a rate
characterized by a rate constant k.
A value of a = 1 can also be obtained in some cases where a reactant B is
involved, under experimental conditions where [B] = [B] e , a concentration
much larger than [A]. We can rearrange Equation 15-5 to separate the variables,
so that only [A] is on the lefthand side of the equation and only t on the
righthand side:
(15-6)
where k' = k[B]%. (The same equation applies where A is the only reactant, but
in that case k' = k.) Using the methods of calculus, we can integrate this
equation so as to relate [A] 0 (the concentration of A that exists at t = 0) to the
value of [A] at any later time t :
- rail-*, f'
JIM,
Qt
JO
,,«,
In [A] - In [A] 0 = -k't
(15-8)
log [A] = - ~ t + log [A] 0
(15-9)
Equation 15-9 relates the experimentally determined values of [A] to the
times t at which the samples were taken. // a reaction is first-order (or pseudo
first-order, as would be the case if [B] is much larger than [ A]) , then a plot of log
[A] versus t will yield a straight line as in Figure 15-4, with slope equal to
-fc'/2.30, and withy intercept equal to log [A] 0 .
In order to find the true rate constant k from the slope of this plot, you must
know b as well as the large excess concentration [B] e . The value of b can be
determined by keeping A at a high known concentration [A] e and then plotting