

232
Molar concentration
.v
/[M]
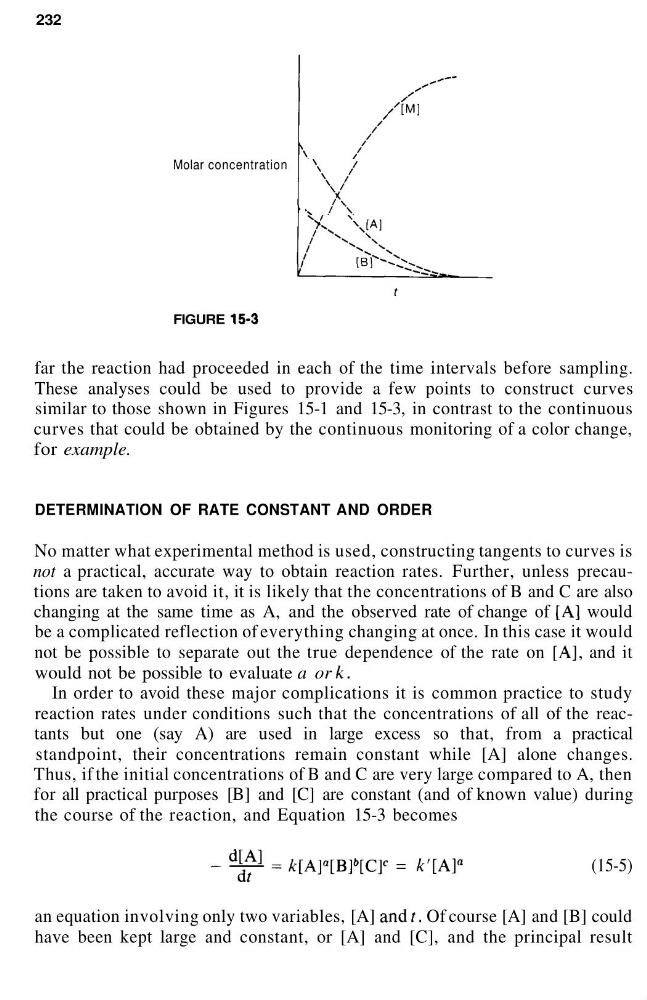
FIGURE 15-3
far the reaction had proceeded in each of the time intervals before sampling.
These analyses could be used to provide a few points to construct curves
similar to those shown in Figures 15-1 and 15-3, in contrast to the continuous
curves that could be obtained by the continuous monitoring of a color change,
for example.
DETERMINATION OF RATE CONSTANT AND ORDER
No matter what experimental method is used, constructing tangents to curves is
not a practical, accurate way to obtain reaction rates. Further, unless precautions are taken to avoid it, it is likely that the concentrations of B and C are also
changing at the same time as A, and the observed rate of change of [A] would
be a complicated reflection of everything changing at once. In this case it would
not be possible to separate out the true dependence of the rate on [A], and it
would not be possible to evaluate a or k.
In order to avoid these major complications it is common practice to study
reaction rates under conditions such that the concentrations of all of the reactants but one (say A) are used in large excess so that, from a practical
standpoint, their concentrations remain constant while [A] alone changes.
Thus, if the initial concentrations of B and C are very large compared to A, then
for all practical purposes [B] and [C] are constant (and of known value) during
the course of the reaction, and Equation 15-3 becomes
= k'[A]
a
(15-5)
an equation involving only two variables, [A] and/. Of course [A] and [B] could
have been kept large and constant, or [A] and [C], and the principal result
Molar concentration
.v
/[M]
FIGURE 15-3
far the reaction had proceeded in each of the time intervals before sampling.
These analyses could be used to provide a few points to construct curves
similar to those shown in Figures 15-1 and 15-3, in contrast to the continuous
curves that could be obtained by the continuous monitoring of a color change,
for example.
DETERMINATION OF RATE CONSTANT AND ORDER
No matter what experimental method is used, constructing tangents to curves is
not a practical, accurate way to obtain reaction rates. Further, unless precautions are taken to avoid it, it is likely that the concentrations of B and C are also
changing at the same time as A, and the observed rate of change of [A] would
be a complicated reflection of everything changing at once. In this case it would
not be possible to separate out the true dependence of the rate on [A], and it
would not be possible to evaluate a or k.
In order to avoid these major complications it is common practice to study
reaction rates under conditions such that the concentrations of all of the reactants but one (say A) are used in large excess so that, from a practical
standpoint, their concentrations remain constant while [A] alone changes.
Thus, if the initial concentrations of B and C are very large compared to A, then
for all practical purposes [B] and [C] are constant (and of known value) during
the course of the reaction, and Equation 15-3 becomes
= k'[A]
a
(15-5)
an equation involving only two variables, [A] and/. Of course [A] and [B] could
have been kept large and constant, or [A] and [C], and the principal result